UNITED STATES
SECURITIES AND EXCHANGE COMMISSION
WASHINGTON, DC 20549
___________________________________________
FORM 10-K
___________________________________________
|
| |
x | ANNUAL REPORT PURSUANT TO SECTION 13 OR 15(d) OF THE SECURITIES EXCHANGE ACT OF 1934 |
For the fiscal year ended December 31, 2013
OR
|
| |
¨ | TRANSITION REPORT PURSUANT TO SECTION 13 OR 15(d) OF THE SECURITIES EXCHANGE ACT OF 1934 |
For the transition period from to
Commission file number: 001-33292
___________________________________________
CORENERGY INFRASTRUCTURE TRUST, INC.
(Exact name of registrant as specified in its charter)
___________________________________________
|
| | |
Maryland | | 20-3431375 |
(State or other jurisdiction of incorporation or organization) | | (IRS Employer Identification No.) |
|
| | |
1100 Walnut, Ste. 3350 Kansas City, MO | | 64106 |
(Address of Principal Executive Offices) | | (Zip Code) |
Registrant’s telephone number, including area code: (816) 875-3705
|
| | |
Title of Each Class | | Name of Each Exchange On Which Registered |
Common Stock, par value $0.001 per share | | New York Stock Exchange |
Securities registered pursuant to Section 12(g) of the Act: None
___________________________________________
Indicate by check mark if the registrant is a well-known seasoned issuer, as defined in Rule 405 of the Securities Act. Yes ¨ No x
Indicate by check mark if the registrant is not required to file reports pursuant to Section 13 or Section 15(d) of the Act. Yes ¨ No x
Indicate by check mark whether the registrant (1) has filed all reports required to be filed by Section 13 or 15(d) of the Securities Exchange Act of 1934 during the preceding 12 months (or for such shorter period that the registrant was required to file such reports), and (2) has been subject to such filing requirements for the past 90 days. Yes x No ¨
Indicate by check mark whether the registrant has submitted electronically and posted on its corporate Web site, if any, every Interactive Data File required to be submitted and posted pursuant to Rule 405 of Regulation S-T (§232.405 of this chapter) during the preceding 12 months (or for such shorter period that the registrant was required to submit and post such files). Yes x No ¨
Indicate by check mark if disclosure of delinquent filers pursuant to Item 405 of Regulation S-K is not contained herein, and will not be contained, to the best of registrant's knowledge, in definitive proxy or information statements incorporated by reference in Part III of this Form 10-K or any amendment to this Form 10-K. ¨
Indicate by check mark whether the registrant is a large accelerated filer, an accelerated filer, a non-accelerated filer, or a smaller reporting company. See the definitions of “large accelerated filer”, “accelerated filer”, and “smaller reporting company” in Rule 12b-2 of the Exchange Act. (Check one): |
| | | |
Large accelerated filer | ¨ | Accelerated filer | x |
Non-accelerated filer | ¨ (Do not check if a smaller reporting company) | Smaller reporting company | ¨ |
Indicate by check mark whether the registrant is a shell company (as defined in Rule 12b-2 of the Act) Yes ¨ No x
The aggregate market value of common stock held by non-affiliates of the registrant on June 28, 2013, the last business day of the registrant's most recently completed second fiscal quarter, based on the closing price on that date of $6.96 on the New York Stock Exchange was $167,051,416. Common shares held by each executive officer and director and by each person who owns 10% or more of the outstanding common shares (as determined by information provided to the registrant) have been excluded in that such persons may be deemed to be affiliates. This determination of affiliate status is not necessarily a conclusive determination for other purposes.
As of February 28, 2014, the registrant had 31,635,537 common shares outstanding.
DOCUMENTS INCORPORATED BY REFERENCE
Portions of the registrant's Proxy Statement for its 2014 Annual Meeting of Stockholders to be filed not later than 120 days after the end of the fiscal year covered by this Annual Report on Form 10-K are incorporated by reference into Part III of this Form 10-K.
CorEnergy Infrastructure Trust, Inc.
FORM 10-K
FOR THE FISCAL YEAR ENDED DECEMBER 31, 2013
TABLE OF CONTENTS
|
| | | | |
| | | | |
PART I | | | | |
Item 1. | | | | |
Item 1A. | | | | |
Item 1B. | | | | |
Item 2. | | | | |
Item 3. | | | | |
Item 4. | | | | |
PART II | | | | |
Item 5. | | | | |
Item 6. | | | | |
Item 7. | | | | |
Item 7A. | | | | |
Item 8. | | | | |
Item 9. | | | | |
Item 9A. | | | | |
Item 9B. | | | | |
PART III | | | | |
Item 10. | | | | |
Item 11. | | | | |
Item 12. | | | | |
Item 13. | | | | |
Item 14. | | | | |
PART IV | | | | |
Item 15. | | | | |
| | | | |
PART I
ITEM 1. BUSINESS
General
CorEnergy Infrastructure Trust, Inc. (“CorEnergy”) was organized as a Maryland corporation and commenced operations on December 8, 2005. Prior to December 3, 2012, our name was Tortoise Capital Resources Corporation. As used in this report, the terms “we”, “us”, “our” and the “Company” refer to CorEnergy and its subsidiaries. We have elected REIT status for U.S. federal income tax purposes through the filing of Form 1120-REIT. The REIT election is applicable for the calendar year commencing January 1, 2013. Our REIT election, assuming continuing compliance with the then applicable qualification tests, will continue in effect for subsequent taxable years.
We historically operated as a business development company under the name Tortoise Capital Resources Corporation and invested primarily in securities of privately held and micro-cap public companies operating in the U.S. energy sector. In April 2011, in connection with our strategic decision to become a REIT and focus on the acquisition of real property assets in the energy infrastructure sector, our stockholders authorized withdrawal of our election to be treated as a business development company. We do not plan on making additional investments in securities (other than short-term, highly liquid investments to be held pending acquisition of real property assets) and intend to liquidate our existing private securities portfolio in an orderly manner.
Strategy
We are primarily focused on acquiring and financing midstream and downstream real estate assets within the U.S. energy infrastructure sector and concurrently entering into long-term triple net participating leases with energy companies. We also may provide other types of capital, including loans secured by energy infrastructure assets. Targeted assets include pipelines, storage tanks, transmission lines and gathering systems, among others. These sale-leaseback or real property mortgage transactions provide the energy company with a source of capital that is an alternative to sources such as corporate borrowing, bond offerings, or equity offerings. We expect to receive participation features in the financial performance and/or value of the underlying infrastructure real property asset. The triple net lease structure requires that the tenant pay all operating expenses of the business conducted by the tenant, including real estate taxes, insurance, utilities, and expenses of maintaining the asset in good working order.
We intend to acquire assets that are accretive to our stockholders and support our growth as a diversified energy infrastructure real estate investment trust (“REIT”). Our principal objective is to provide stockholders with an attractive risk-adjusted total return, with an emphasis on distributions and long-term distribution growth.
In recent years, the IRS issued several separate private letter rulings that confirmed certain energy infrastructure assets as real estate assets for tax purposes. The potential qualifying real estate assets in the energy infrastructure sector include electric transmission and distribution systems; and hydrocarbon gathering systems, storage, terminaling and distribution systems. We refer to such REIT-qualifying assets herein as “real property assets.” While private letter rulings provide insight into the current thinking of the IRS on tax issues, such rulings may only be relied upon by the taxpayer to whom they were issued.
Recent Developments
Lease Agreement with Arc Logistics
Subsequent to year-end, we completed a follow-on equity offering of 7,475,000 shares of common stock, raising approximately $49 million in gross proceeds at $6.50 per share (net proceeds of approximately $46 million after underwriters’ discount). On January 21, 2014, our subsidiary, LCP Oregon, used the net proceeds from the offering to acquire a petroleum products terminal facility located in Portland, Oregon ("Portland Terminal Facility") (the “Acquisition”).
LCP Oregon entered into a long-term triple net Lease Agreement on January 21, 2014, relating to the use of the Portland Terminal Facility (the “Portland Lease Agreement”) with Arc Terminals Holdings LLC ("Arc Terminals"), an indirect wholly-owned subsidiary of Arc Logistics Partners LP ("Arc Logistics"). Arc Logistics has guaranteed the obligations of Arc Terminals under the Portland Lease Agreement. The Portland Lease Agreement grants Arc Terminals substantially all authority to operate the Portland Terminal Facility. During the initial term, Arc Terminals will make base monthly rental payments and variable rent payments based on the volume of liquid hydrocarbons that flowed through the Portland Terminal Facility in the prior month. The base rent in the initial year of the Portland Lease Agreement increases to approximately $417,522 per month starting with August 2014 and each month thereafter. The base rent is also expected to increase during the initial year of the Portland Lease Agreement based on a percentage of specified construction costs at the Portland Terminal Facility incurred by LCP Oregon, estimated at $10 million. Variable rent is capped at 30 percent of total rent, which would be the equivalent of the Portland Terminal Facility’s expected throughput capacity.
Arc Logistics is a fee-based, growth-oriented Delaware limited partnership formed by Lightfoot to own, operate, develop and acquire a diversified portfolio of complementary energy logistics assets. In November 2013, Arc Logistics completed its IPO. Arc Logistics’ public disclosures filed with the SEC indicate that Arc Logistics is principally engaged in the terminaling, storage, throughput and transloading of crude oil and petroleum products with energy logistics assets strategically located in the East Coast, Gulf Coast and Midwest regions of the U.S. It is focused on growing its business through the optimization, organic development and acquisition of terminaling, storage, rail, pipeline and other energy logistics assets that generate stable cash flows and offer customers multiple supply and delivery modes via pipelines, rail, marine and truck. Arc Logistics indicated in its IPO that it had approximately 5.0 million barrels of crude oil and petroleum product storage capacity. Arc Terminals is a wholly-owned subsidiary of Arc Logistics.
Loan Agreement with Black Bison
On March 13, 2014, our subsidiary Corridor Bison, LLC ("Corridor Bison") entered into a Loan Agreement with Black Bison Water Services, LLC ("Water Services"), pursuant to which Corridor Bison agreed to loan to Water Services up to $11,500,000 (the "Loan"). The proceeds of the Loan are to be used by Water Services and its affiliates to finance the acquisition and development of real property that will provide water sourcing, water disposal, or water treating/recycling services for the oil and natural gas industry. Water Services' initial Loan draw in the amount of $4,265,000 was used to acquire real property in Wyoming and to pay Loan transaction expenses.
Interest will initially accrue on the outstanding principal amount of the Loan at an annual base rate of 12 percent, which base rate will increase by 2 percent of the current base rate per year. In addition, starting in April 2015 and continuing for each month thereafter, the outstanding principal of the Loan will bear variable interest calculated as a function of the increase in volume of water treated by Water Services during the particular month. The base rent plus variable rent is capped at 19 percent per annum. The Loan matures on March 31, 2024 and is to be amortized by quarterly payments beginning March 31, 2015 and annual pre-payments based upon free cash flows of the Borrower and its affiliates commencing in April 2015. The Loan is secured by the real property and equipment held by Water Services and the outstanding equity in Water Services and its affiliates. The Loan is also guarantied by all affiliates of Water Services.
As a condition to the Loan, Corridor Bison acquired a Warrant to purchase up to 15 percent of the outstanding equity of Black Bison Intermediate Holdings, LLC ("Intermediate Holdings"). Corridor Bison paid $34,000 for the Warrant, which amount was determined to represent the fair value of the Warrant as of the date of purchase. The exercise price of the Warrant, $3.16 per Unit, was determined based on the value of 15 percent of the contributed capital of Intermediate Holdings as of the date of purchase and increases at a rate of 12 percent per annum. The Warrant grants to Corridor Bison certain rights with respect to the management of the Intermediate Holdings and Water Services.
Competitive Advantages
We believe that we are well-positioned to meet the capital needs of companies within the U.S. energy infrastructure sector for the following reasons:
| |
• | Attractive Partner for Energy Infrastructure Companies. We believe that we are a desirable partner for energy infrastructure companies because we have specialized knowledge of the economic, regulatory, and stakeholder considerations faced by them. We are an attractive capital provider because we do not intend to compete with the operations of our lessees, are willing to enter into long-term lease, facilitate development of assets and capital arrangements that suit the requirements and achieve the goals of energy infrastructure companies. |
| |
• | Broad Energy Infrastructure Scope. The universe of assets that may be owned by a REIT has expanded significantly. The Internal Revenue Service has, through a series of private letter rulings, recently confirmed new types of assets in the energy sector are eligible to be owned by a REIT, including electric transmission and distribution systems, pipeline systems, and storage and terminaling systems. While only the requesting party may rely on these rulings, they give insight into the potential for REIT qualifying assets. We also intend to acquire assets that do not generate qualifying income for MLPs, such as renewables and electric power transmission. |
| |
• | Efficient Capital Provider. As a REIT, our stockholders will generally not receive Unrelated Business Taxable Income or Effectively Connected Income. This offers us access to investors desiring the risk-adjusted return profile that we intend to provide but who are unable to invest directly in companies owning infrastructure assets, such as private equity funds or MLPs. |
| |
• | Disciplined Investment Philosophy. Our investment approach emphasizes overall asset operational and financial performance with the potential for enhanced returns through incremental asset growth, capital appreciation, and minimization of downside risk. Our process for selecting investments involves an assessment of the overall attractiveness |
of the specific subsector of the energy infrastructure sector in which a prospective tenant company is involved; such company’s specific competitive position within that subsector; operational asset engineering due diligence; potential commodity price impact, supply and demand and regulatory concerns; the stability and potential growth of the prospective real property asset’s cash flows; the prospective operating company’s management track record; and our ability to structure an attractive investment.
| |
• | Experienced Management Team. The five principals of Corridor have an average of over 26 years of experience in energy operations of multi-national electric and gas utilities and other national energy marketing and trading businesses and in optimizing portfolios for real property energy asset investments. Based on their real property asset operational experience and strong industry relationships, we believe that the principals of Corridor provide the expertise and knowledge necessary to acquire real property assets with strong performance standards. |
| |
• | Extensive Relationships. The principals of Corridor maintain relationships with various owners and operators of real property assets in the energy infrastructure sector. They regularly communicate with these owners and operators to discuss their real property assets and the potential for structuring financing transactions that would be beneficial both to them and to us. |
| |
• | Manager’s Affiliation with Tortoise Capital Advisors, LLC. Our manager, Corridor, is an affiliate of TCA, a registered investment adviser with approximately $15.0 billion of assets under management in the U.S. energy infrastructure sector as of February 28, 2014. Corridor has access to certain resources of TCA while acting as our manager. |
Market Opportunity
We believe the environment for acquiring energy infrastructure real property assets is attractive for the following reasons:
| |
• | Energy infrastructure provides essential services, and the demand for energy resources is expected to grow in the future. We believe energy infrastructure is the backbone of the U.S. economy. The energy infrastructure sector includes the pipes, wires and storage facilities that connect and deliver some of our most critical resources: electricity, oil and natural gas. |
The demand for energy resources is correlated with population growth and has a low correlation to market cycles. U.S. energy consumption is forecasted to grow by 13 percent from 2012 to 2040 according to the U.S. Energy Information Administration’s (“EIA”) Annual Energy Outlook 2014. Demand for natural gas continues to increase as electric power generation companies switch to lower-cost, cleaner burning fuels such as natural gas. Natural gas is the cleanest fossil fuel, with lower carbon dioxide emissions than coal or oil. In recent years, 80 to 90 percent of the natural gas consumed in the United States is produced domestically.
The U.S. is the third largest producer of crude oil and the largest producer of natural gas and natural gas liquids in the world. The United States has an abundant supply of natural gas, enough to last for approximately 100 years, according to the American Gas Association.
| |
• | Investment is needed in U.S. energy infrastructure. Due to renewable energy requirements, rapid technological advances in the methods used to extract oil and natural gas, and aging infrastructure, substantial amounts of capital are expected to be invested in energy infrastructure. A 2013 Deloitte publication noted that $200 billion in midstream investments will be required to accommodate the development of natural gas, oil and natural gas liquid resources through 2035. |
The Edison Electric Institute ("EEI") is projecting that $1.5 - $2.0 trillion will need to be invested in electricity infrastructure between 2010 and 2030. Of this total, EEI projects nearly $300 billion and $600 billion will be invested in electricity transmission and distribution, respectively. We believe the that the U.S. electricity sector's high level of projected capital expenditures and continued investiture activity provide numerous attractive acquisition opportunities.
| |
• | There are a number of attractive operating companies with capital needs. We believe that the capital expansion plans of operating companies in the midstream and downstream segments of the U.S. energy infrastructure sector provide us attractive real property acquisition opportunities. The energy industry is characterized by assets with high barriers to entry, providing confidence that over an extended lease term an asset is unlikely to lose market share to a newly constructed asset. In addition, we can offer capital for assets that currently do not generate qualifying income for MLPs, such as renewables and electric power transmission. |
| |
• | There are a large number of assets in the energy infrastructure sector that are able to be held by a REIT. In recent years, the Internal Revenue Service (“IRS”) issued several separate private letter rulings that confirmed certain energy infrastructure assets as real property assets for tax purposes. The qualifying real property assets in the energy infrastructure sector include electric transmission and distribution systems, hydrocarbon gathering systems, storage, terminaling and |
distribution systems. While private letter rulings provide insight into the current thinking of the IRS on tax issues, such rulings may only be relied upon by the taxpayer to whom they were issued. We have not obtained any private letter rulings.
Targeted Investment Characteristics
We pursue our business objective by investing principally in the energy infrastructure sector. The energy infrastructure sector broadly includes midstream, downstream and upstream assets. We intend to focus primarily on midstream and downstream assets as described below.
| |
• | Midstream – the gathering, processing, storing, terminaling and transporting of energy resources and their byproducts in a form that is usable by wholesale power generation, utility, petrochemical, industrial and refined products customers, including pipelines, natural gas processing plants, liquefied natural gas facilities and other energy infrastructure companies. |
| |
• | Downstream – the refining of energy sources, and the marketing and distribution of products, such as natural gas, propane and gasoline, to end-user customers; and the transmission and distribution of electricity from coal, nuclear, natural gas, agricultural, thermal, solar, wind and biomass power generation facilities. |
We anticipate that our targeted real property asset acquisitions will have the following characteristics:
| |
• | Long-Life Assets with Stable Cash Flows and Limited Commodity Price Sensitivity. We will seek real property assets having the potential to generate stable cash flows over long periods of time. We have historically invested in companies that own and operate assets with long useful lives and that generate cash flows by providing critical services primarily to the producers or end-users of energy. We have attempted to limit the direct exposure to energy commodity price risk in our portfolio. We have targeted companies that have a majority of their cash flows generated by contractual obligations. Our planned acquisitions of real property assets will continue to reflect these characteristics. Acquired real property assets will have a long useful life. We anticipate our real property assets will generate contracted cash flows with third party entities over the term of the investment, thus providing stable cash flows underlying our leases. |
| |
• | Experienced Management Teams with Energy Focus. We have targeted assets operated by management teams that have a track record of success and that have substantial knowledge in particular segments of the energy sector or with certain types of assets. We expect that our management teams’ extensive experience and network of business relationships in the energy sector will allow us to identify and attract opportunities to acquire real property assets that meet these criteria. |
| |
• | Fixed Asset-Intensive Investments. Most of our investments have been made in companies with a relatively significant base of fixed assets. As we directly acquire infrastructure real property assets, our portfolio will reflect the nature of fixed-asset investments. Fixed-asset investments characteristically display such attributes as long-term stability, low volatility, diversification via low correlation and relatively inelastic demand. |
| |
• | Limited Technological Risk. We generally do not target acquisition opportunities involving the application of new technologies or significant geological, drilling or development risk. |
| |
• | Growth Opportunities. We generally will seek to enter into leases that provide base rent and participating rent over the term of the lease. These increases are expected to be fixed or tied generally to increases in indices such as the Consumer Price Index (the "CPI"). We may also attempt to obtain equity enhancements in connection with transactions. These equity enhancements may involve warrants exercisable at a future time to purchase stock of the tenant or borrower or their parent. |
Assets, Wholly-owned Subsidiary and Private Equity Investments
Portland Terminal Facility, acquired January 21, 2014
The Portland Terminal Facility is a rail/marine facility property adjacent to the Willamette River in Portland, Oregon. The 42-acre site has 84 tanks with a total storage capacity of approximately 1,500,000 barrels. The Portland Terminal Facility is capable of receiving, storing and delivering crude oil and refined petroleum products. Products are received and/or delivered via railroad or marine (up to Panamax-size vessels). The marine facilities are accessed through a neighboring terminal facility via an owned pipeline. The Portland Terminal Facility offers heating systems, emulsions and an on-site product testing laboratory as ancillary services.
Our subsidiary, LCP Oregon acquired the Portland Terminal Facility on January 21, 2014. The Portland Terminal Facility is triple-net leased to Arc Logistics. Arc Terminals’ obligations under the Portland Lease Agreement are guaranteed by Arc Logistics.
Pinedale Liquids Gathering System
Construction of the Pinedale Liquids Gathering System ("Pinedale LGS") was completed by Ultra Petroleum Corp. ("Ultra Petroleum") in 2010 and consists of more than 150 miles of pipelines with 107 receipt points, and four central storage facilities that are utilized by Ultra Petroleum as a method for the gathering of commingled hydrocarbon stream, then this stream is separated into its components of water, condensate and natural gas, for the purpose of subsequently storing, selling or disposing of these separated components. Condensate is a valuable hydrocarbon commodity that is sold by Ultra Petroleum; water is transported to disposal wells or a treatment facility for re-use; and natural gas is sold by Ultra Petroleum or otherwise used by Ultra Petroleum for fueling on-site operational equipment. Ultra Petroleum’s non-operating working interest partners in the Pinedale field where the Pinedale LGS is located pay Ultra Petroleum a fee for the use of Ultra Petroleum’s LGS. To date, no major operational issues have been reported with respect to the Pinedale LGS.
Our subsidiary, Pinedale Corridor, LP ("Pinedale LP"), acquired the Pinedale LGS with associated real property rights in the Pinedale Anticline in Wyoming from an indirect wholly-owned subsidiary of Ultra Petroleum on December 20, 2012. The Pinedale LGS assets are triple-net leased to Ultra Wyoming LGS, LLC ("Ultra Wyoming"), another subsidiary of Ultra Petroleum (the "Pinedale Lease Agreement"). The Prudential Insurance Company of America ("Prudential") owns an 18.95 percent economic interest in Pinedale LP.
During the initial fifteen-year term of the Pinedale Lease Agreement, Pinedale LP will receive a fixed minimum annual rent ("base rent") of $20 million, adjusted annually for changes based on the CPI. The annual adjustment for changes in the CPI commenced January 1, 2014 (subject to a 2 percent annual cap) with an increase of 1.53 percent to base rent. Starting in January 2014, we became eligible for a variable rent component based on the increase in volumes, if any, of liquid hydrocarbons and water that flowed through the Pinedale LGS in a prior month. The maximum annual rental payments under the Pinedale Lease Agreement during the initial fifteen year term are $27.5 million.
Ultra Wyoming’s obligations under the Pinedale Lease Agreement are guaranteed by Ultra Petroleum and Ultra Petroleum’s operating subsidiary, Ultra Resources, Inc. (“Ultra Resources”), pursuant to the terms of a parent guaranty. Currently, the Pinedale LGS accounts for a significant portion of our total assets, and the lease payments under the Pinedale Lease Agreement account for a significant portion of our total revenue. Accordingly, the financial condition of Ultra Wyoming, Ultra Resources and Ultra Petroleum and the ability and willingness of each to satisfy its obligations under the Pinedale Lease Agreement and the related parent guaranty will have a major impact on our results of operation, ability to service our indebtedness and ability to make distributions. For additional information, see “Major Tenants” under Item 7 “Management’s Discussion and Analysis of Financial Condition and Results of Operations” in this Form 10-K.
On December 12, 2013, Ultra Petroleum closed on the acquisition of approximately 8,000 net acres of oil and gas properties in Utah’s Uinta Basin for approximately $649.8 million. Upon closing of the acquisition, Ultra Petroleum immediately took over operations and maintained continuous drilling, completion and production operations. By year end 2013, Ultra Petroleum drilled three wells in the field and plans to continue a one rig program throughout 2014. Ultra Petroleum is the sole operator of the properties with a 100 percent working interest. It is currently producing 7,100 barrels of oil per day from 51 producing wells.
Eastern Interconnect Project
We own a 40 percent undivided interest in the Eastern Interconnect Project (EIP) transmission assets, which move electricity across New Mexico between Albuquerque and Clovis. The physical assets include 216 miles of 345 kilovolts transmission lines, towers, easement rights, converters and other grid support components. The EIP is a critical, East-West link on the PNM transmission grid. Construction of the Line was completed in 1984 and is expected to have at a minimum an additional twenty years of useful life.
These assets are leased on a triple net basis through April 1, 2015 to Public Service Company of New Mexico ("PNM"), an independent electric utility company serving approximately 500 thousand customers in New Mexico. PNM is a subsidiary of PNM Resources Inc. (NYSE: PNM). On November 1, 2012, we entered into a purchase agreement with PNM to sell our interest in the EIP upon lease termination on April 1, 2015 for $7.7 million. PNM also accelerated its remaining lease payments to us. Both lease payments due in 2013 were paid upon execution of that purchase agreement on November 1, 2012. The three remaining lease payments which would have been due April 1, 2014, October 1, 2014 and April 1, 2015, were paid in full on January 2, 2014.
Mowood, LLC
Mowood Corridor, Inc. is a wholly-owned taxable REIT subsidiary of the Company. Mowood, LLC ("Mowood") is wholly-owned by Mowood Corridor, Inc. and is the holding company of Omega Pipeline Company, LLC ("Omega"). Omega is a natural gas service provider located primarily on the Fort Leonard Wood military post in south-central Missouri. Omega has a long-term contract with the Department of Defense, which is currently subject to renewal in 2015, to provide natural gas and gas distribution
services to Fort Leonard Wood through Omega’s approximately 70 mile pipeline distribution system on the post. In addition, Omega provides natural gas marketing services to several customers in the surrounding area. We own indirectly 100 percent of the equity interests in Mowood.
VantaCore Partners LP
We hold an 11 percent direct investment as of December 30, 2013 in VantaCore Partners LP (“VantaCore”), a private company. VantaCore’s operations consist of an integrated limestone quarry (with permitted surface reserves of about 72 million tons), a dock facility, two asphalt plants and a commercial asphalt lay down business located in Clarksville, Tennessee, a limestone quarry located in Todd County, Kentucky, a sand and gravel business (with approximately 40 million tons of gravel reserves) located near Baton Rouge, Louisiana serving the south central Louisiana market and a surface and underground limestone quarry (with in excess of 200 million tons of reserves) located in Pennsylvania serving energy and construction businesses in Pennsylvania, West Virginia and Ohio. We hold observation rights on VantaCore’s Board of Directors.
Lightfoot Capital Partners, LP and Lightfoot Capital Partners GP LLC
We hold a direct investment in Lightfoot Capital Partners, LP (6.6 percent) and Lightfoot Capital Partners GP LLC (1.5 percent) (collectively “Lightfoot”). Lightfoot’s assets include an ownership interest in Gulf LNG, a 1.5 billion cubic feet per day (“bcf/d”) receiving, storage, and regasification terminal in Pascagoula, Mississippi, and common units and subordinated units representing an approximately 40 percent aggregate limited partner interest, and a noneconomic general partner interest, in Arc Logistics Partners LP (NYSE: ARCX) (“Arc Logistics”), a fee-based, growth-oriented Delaware limited partnership formed by Lightfoot to own, operate, develop and acquire a diversified portfolio of complementary energy logistics assets that is principally engaged in the terminaling, storage, throughput and transloading of crude oil and petroleum products. In November 2013, Arc Logistics completed its initial public offering (“IPO”) of common units. We hold observation rights on Lightfoot's Board of Directors.
Investment Strategies and Due Diligence
In analyzing potential real property acquisitions, we intend to review all aspects of a transaction, including tenant and asset fundamentals, to determine whether a potential acquisition and lease can be structured to satisfy our investment criteria. In evaluating net lease transactions, we generally consider, among other things, the following aspects of each transaction:
| |
• | Tenant/Borrower Evaluation — We evaluate each potential tenant or borrower for its creditworthiness, typically considering factors such as management experience, industry position and fundamentals, operating history, and capital structure, as well as other factors that may be relevant to a particular acquisition. We seek opportunities in which we believe the tenant may have a stable or improving credit profile or credit potential that has not been recognized by the market. In evaluating a possible investment, the creditworthiness of a tenant or borrower often will be balanced with the value of the underlying real estate, particularly if the underlying property is specifically suited to the needs of the tenant. Whether a prospective tenant or borrower is creditworthy will be determined by our management team and reviewed by the investment committee, as described below. Creditworthy does not necessarily mean “investment grade.” |
| |
• | Important to Tenant/Borrower Operations — We generally will focus on properties that we believe are essential or important to the ongoing operations of the tenant. We believe that this type of property will provide a relatively low risk of loss in the case of a potential bankruptcy or abandonment scenario since a tenant/borrower is less likely to risk the loss of a critically important lease or property. |
| |
• | Diversification — We attempt to diversify our portfolio to avoid dependence on any one particular tenant, borrower, collateral type, and geographic location within the U.S. or tenant/borrower industry. By diversifying, we seek to reduce the adverse effect of a single under-performing investment or a downturn in any particular asset or geographic region within the U.S. |
| |
• | Lease Terms — Generally, the net leased properties we will acquire will be leased on a full recourse basis to the tenants or their affiliates. In addition, we generally will seek to include a clause in each lease that provides for increases in rent over the term of the lease. These increases are fixed or tied generally to increases in indices such as the CPI. The lease will also generally seek to provide for participation in gross revenues of the tenant at the property, thereby providing exposure to the commercial activity of the tenant, and providing the tenant some flexibility in lease terms. Alternatively, a lease may provide for mandated rental increases on specific dates, and we may adopt other methods in the future. |
| |
• | Collateral Evaluation—We review the physical condition of the property and assess the likelihood of replacing the rental payment stream if the tenant defaults. We also generally engage a third party to conduct, or require the seller to conduct a preliminary examination, or Phase 1 assessment, of the site to determine the potential for contamination or similar environmental site assessments in an attempt to identify potential environmental liabilities associated with a property prior to its acquisition. If potential environmental liabilities are identified, we generally require that identified |
environmental issues be resolved by the seller prior to property acquisition or, where such issues cannot be resolved prior to acquisition, require tenants contractually to assume responsibility for resolving identified environmental issues post-closing and provide indemnification protections against any potential claims, losses or expenses arising from such matters. We generally rely on our own analysis to determine whether to make an acquisition. Our analysis may take into consideration, among other things, the terms and conditions of the particular lease transaction, the quality of the lessee’s credit and the conditions of the credit markets at the time the lease transaction is negotiated. The value may be greater than the construction cost or the replacement cost of a property, and the actual sale price of a property if sold may be greater or less than the acquisition cost. In cases of special purpose real estate which we expect to acquire, a property is examined in light of the prospects for the tenant/borrower’s enterprise and the financial strength and the role of that asset in the context of the tenant’s overall viability. Operating results of properties and other collateral may be examined to determine whether or not projected income levels are likely to be met.
| |
• | Transaction Provisions to Enhance and Protect Value—We attempt to include provisions in the leases that we believe may help protect a real property asset from changes in the operating and financial characteristics of a tenant that may affect its ability to satisfy its obligations or reduce the value of the real property asset. Such provisions include requiring our consent to specified tenant activity, requiring the tenant to provide indemnification protections, and requiring the tenant to satisfy specific operating tests. We may also seek to enhance the likelihood of a tenant’s lease obligations being satisfied through a guaranty of obligations from the tenant’s corporate parent or other entity or a letter of credit. This credit enhancement, if obtained, provides additional financial security. However, in markets where competition for net lease transactions is strong, some or all of these provisions may be replaced by other measures of credit quality such as tenant investment in leasehold improvements and commercial enterprise value of the tenant business conducted in the property. |
In addition, in some circumstances, tenants may retain the right to repurchase the leased property. We expect, in those situations that the option purchase price will generally be the greater of the contract purchase price or the fair market value of the property at the time the option is exercised.
| |
• | Equity Enhancements — We may attempt to obtain equity enhancements in connection with transactions. These equity enhancements may involve warrants exercisable at a future time to purchase stock of the tenant or borrower or their parent. If warrants are obtained, and become exercisable, and if the value of the stock subsequently exceeds the exercise price of the warrant, equity enhancements can help achieve the goal of increasing investor returns. |
| |
• | Other Real Estate Related Assets — As other opportunities arise, we may also seek to expand the portfolio to include other types of real estate-related investments, in all cases within the energy infrastructure sector, such as: |
| |
• | equity investments in real properties that are not long-term net leased to a single-tenant and may include partially leased properties, undeveloped properties and properties subject to short-term net leases, among others; |
| |
• | mortgage loans secured by real properties; |
| |
• | subordinated interests in first mortgage real estate loans, or B-notes; |
| |
• | mezzanine loans related to real estate, which are senior to the borrower’s equity position but subordinated to other third-party financing; and |
| |
• | equity and debt securities (including preferred equity, limited partnership interests, trusts and other higher-yielding structured debt and equity investments) issued by companies that are engaged in real-estate-related businesses as defined by regulations promulgated under the Internal Revenue Code (the “Code”), including other REITs. |
Environmental Matters
A discussion of the current effects and potential future impacts on our business and properties of compliance with federal, state and local environmental regulations is presented in Item 1A of this Annual Report on Form 10-K under the subheading “Risks Related to an Investments in Real Estate and the U.S. Energy Infrastructure Sector – Costs of complying with governmental laws and regulations, including those relating to environmental matters, may adversely affect our income and the cash available for distribution.”
Financing Strategies
Consistent with our asset acquisition policies, we use leverage when available on terms we believe are favorable. The amount of leverage that we may employ will depend on our assessment of market conditions and other factors at the time of any proposed borrowing. Although we currently do not anticipate doing so, the amount of total leverage we employ may exceed 50 percent of our total assets. Substantially all of our mortgage loans are expected to be non-recourse. A lender on non-recourse mortgage debt generally has recourse only to the property collateralizing such debt and not to any of our other assets, while full recourse financing would give the lender recourse to all of our assets. The use of non-recourse debt, therefore, helps us to limit the exposure of all of
our assets to any one debt obligation. Lenders may, however, have recourse to our other assets in limited circumstances not related to the repayment of the indebtedness, such as under an environmental indemnity. We also expect to have an unsecured line of credit that can be used in connection with refinancing existing debt and making new acquisitions, as well as to meet other working capital needs. We intend to incur debt which bears interest at fixed rates, or is effectively converted to fixed rates through interest rate caps or swap agreements.
Competition
We compete with public and private funds, commercial and investment banks and commercial financing companies to make the types of investments that we plan to make in the U.S. energy infrastructure sector. Many of our competitors are substantially larger and have considerably greater financial, technical and marketing resources than us. For example, some competitors may have a lower cost of funds and access to funding sources than are available to us. In addition, some of our competitors may have higher risk tolerances or different risk assessments, allowing them to consider a wider variety of investments and establish more relationships than us. These competitive conditions may adversely affect our ability to make investments in the energy infrastructure sector and could adversely affect our distributions to stockholders.
MANAGEMENT
Our Manager
We have no employees. We are externally managed by Corridor InfraTrust Management, LLC (“Corridor”), an affiliate of Tortoise Capital Advisors, L.L.C. (“TCA”). TCA is a registered investment adviser with approximately $15.0 billion of assets under management in the U.S. energy infrastructure sector and 53 employees as of February 28, 2014. Corridor is a real property asset manager with a focus on U.S. energy infrastructure real property assets and has access to certain resources of TCA while acting as our manager. Corridor assists us in identifying infrastructure real property assets that can be leased to businesses that make goods, provide services or own assets other than securities, and is generally responsible for our day-to-day operations.
Corridor Team
Each of our officers is an employee of Corridor or one of its affiliates. Corridor is not obligated to dedicate certain of its employees exclusively to us, nor are it or its employees obligated to dedicate any specific portion of its or their time to our business. As described below, we pay a management fee and certain other fees to Corridor, which it uses in part to pay compensation to its officers and employees who, notwithstanding that certain of them also are our officers, receive no cash compensation directly from us.
We pay Corridor a management fee based on total assets under management. In aligning our strategy to focus on distributions and distribution growth, Corridor is paid an incentive fee based on increases in distributions to our stockholders. A percentage of the Corridor incentive fee is reinvested in CorEnergy. Pursuant to a Management Agreement and an Administrative Agreement, Corridor has agreed to use its reasonable best efforts to present us with suitable acquisition opportunities consistent with our investment objectives and policies and is generally responsible, subject to the supervision and review of our Board of Directors, for our day-to-day operations.
Real Property Asset Management
The Corridor team has experience across several segments of the energy sector and is primarily responsible for investigating, analyzing and selecting potential infrastructure asset acquisition opportunities. Acquisitions and transactions are submitted to our Board of Directors for final approval following a recommendation from the management team.
We believe that effective management of our assets is essential to maintain and enhance property values. Important aspects of asset management include restructuring transactions to meet the evolving needs of current tenants, re-leasing properties, refinancing debt, selling properties and knowledge of the bankruptcy process.
We monitor, on an ongoing basis, compliance by tenants with their lease obligations and other factors that could affect the financial performance of any of our properties. Monitoring involves receiving assurances that each tenant has paid real estate taxes, assessments and other expenses relating to the properties it occupies and confirming that appropriate insurance coverage is being maintained by the tenant. We review financial statements of tenants and undertake regular physical inspections of the condition and maintenance of properties. In addition, we periodically analyze each tenant’s financial condition and the industry in which each tenant operates.
Private Portfolio Monitoring
We monitor our two portfolio companies to determine progress relative to meeting the Company’s business plan and to assess the Company’s strategic and tactical courses of action. This monitoring is accomplished by attendance at Board of Directors meetings,
ad hoc communications with portfolio company management, the review of periodic operating and financial reports, an analysis of relevant reserve information and capital expenditure plans, and periodic consultations with engineers, geologists, and other experts. The performance of each private portfolio company is also periodically compared to performance of similarly sized companies with comparable assets and businesses to assess performance relative to peers. Corridor’s monitoring activities are expected to provide us with information that will enable us to monitor compliance with existing covenants.
Management Agreement
On December 1, 2011, the Company executed a Management Agreement with Corridor InfraTrust Management, LLC (“Corridor”). Under the Management Agreement, Corridor (i) presents to the Company suitable acquisition opportunities consistent with the investment policies and objectives of the Company, (ii) is responsible for the day-to-day operations of the Company, and (iii) performs such services and activities relating to the assets and operations of the Company as may be appropriate. The terms of the Management Agreement include a quarterly management fee equal to 0.25 percent (1.00 percent annualized) of the value of the Company’s average monthly Managed Assets for such quarter. For purposes of the Management Agreement, “Managed Assets” means all of the securities of the Company and all of the real property assets of the Company (including any securities or real property assets purchased with or attributable to any borrowed funds) minus all of the accrued liabilities other than (1) deferred taxes and (2) debt entered into for the purpose of leverage. For purposes of the definition of Managed Assets, “securities” includes the Company’s security portfolio, valued at then current market value. For purposes of the definition of Managed Assets, “real property assets” includes the assets of the Company invested, directly or indirectly, in equity interests in or loans secured by real estate and personal property owned in connection with such real estate (including acquisition related costs and acquisition costs that may be allocated to intangibles or are unallocated), valued at the aggregate historical cost, before reserves for depreciation, amortization, impairment charges or bad debts or other similar noncash reserves. Corridor also receives a quarterly incentive fee equal to 10 percent of the increase in total dividends paid, if any, over a threshold dividend equal to $0.125 per share per quarter. A new Management Agreement between the Company and Corridor was approved by the Board of Directors and became effective July 1, 2013. The new agreement does not change in any respect the terms for determination or payment of compensation for the Manager, does not have a specific term, and will remain in place unless terminated by the Company or the Manager in the manner permitted pursuant to the agreement.
Advisory Agreement
On December 1, 2011, we entered into an Advisory Agreement by and among the Company, TCA and Corridor, under which TCA provided certain securities focused investment services necessary to evaluate, monitor and liquidate the Company’s remaining securities portfolio (“Designated Advisory Services”), and also provided the Company with certain operational (i.e. non-investment) services (“Designated Operational Services”). Effective December 21, 2012, that agreement was replaced by an Amended Advisory Agreement pursuant to which TCA provides investment services related to the monitoring and disposition of our current securities portfolio.
Administrative Agreement
On December 1, 2011, we entered into an Administrative Agreement with TCA. During the fourth quarter of 2012, Corridor assumed the TCA’s administrator duties, retroactive to August 7, 2012. Our administrator performs (or oversees or arranges for the performance of) the administrative services necessary for our operation, including without limitation providing us with equipment, clerical, bookkeeping and record keeping services. For these services we pay our administrator a fee equal to 0.04 percent of our aggregate average daily Managed Assets, with a minimum annual fee of $30,000.
Pursuant to the Management and Administrative Agreements, Corridor furnishes us with office facilities and clerical and administrative services necessary for our operation (other than services provided by our custodian, accounting agent, administrator, dividend and interest paying agent and other service providers). Corridor is authorized to enter into agreements with third parties to provide such services. To the extent we request, Corridor will (i) oversee the performance and payment of the fees of our service providers and make such reports and recommendations to the Board of Directors concerning such matters as the parties deem desirable, (ii) respond to inquiries and otherwise assist such service providers in the preparation and filing of regulatory reports, proxy statements, and stockholder communications, and the preparation of materials and reports for the Board of Directors; (iii) establish and oversee the implementation of borrowing facilities or other forms of leverage authorized by the Board of Directors and (iv) supervise any other aspect of our administration as may be agreed upon by us and Corridor. We have agreed, pursuant to the Management Agreement, to reimburse Corridor for all out-of-pocket expenses incurred in providing the foregoing.
We bear all expenses not specifically assumed by Corridor and incurred in our operations. The compensation and allocable routine overhead expenses of all management professionals of Corridor and its staff, when and to the extent engaged in providing us management services, is provided and paid for by Corridor and not us.
Duration and Termination
The Management Agreement and the Administrative Agreement (“the Agreements”) were initially reviewed and approved by our Board of Directors. The Agreements are renewable annually thereafter by us. The Agreements may be terminated by us, by vote of the Board of Directors, without penalty upon not more than 60 days’ written notice to Corridor.
Available Information
Our principal executive offices are located at 1100 Walnut Street, Suite 3350, Kansas City, MO 64106. Our telephone number is (816) 875-3705, or toll-free (877) 699-2677, and our Web site is http://corenergy.corridortrust.com. We are required to file reports, proxy statements and other information with the SEC. We will make available free of charge our Annual Report on Form 10-K, Quarterly Reports on Form 10-Q, Current Reports on Form 8-K and any amendments to those reports on or through our Web site at http://corenergy.corridortrust.com as soon as reasonably practicable after such material is electronically filed with, or furnished to, the SEC. This information may also be obtained, without charge, upon request by calling us at (816) 875-3705 or toll-free at (877) 699-2677. This information will also be available at the SEC’s Public Reference Room at 100 F Street, NE, Washington, DC 20549. You may obtain information on the operation of the Public Reference Room by calling the SEC at 1-800-SEC-0330. The SEC maintains an Internet site that contains reports, proxy and information statements and other information filed by us with the SEC which is available on the SEC’s Internet site at www.sec.gov. Please note that any Internet addresses provided in this Form 10-K are for informational purposes only and are not intended to be hyperlinks. Accordingly, no information found and/or provided at such Internet address is intended or deemed to be included by reference herein.
ITEM 1A. RISK FACTORS
There are many risks and uncertainties that can affect our future business, financial performance or share price. Many of these are beyond our control. A description follows of some of the important factors that could have a material negative impact on our future business, operating results, financial condition or share price. This discussion includes a number of forward-looking statements. You should refer to the description of the qualifications and limitations on forward-looking statements in the first paragraph under Item 7 “Management’s Discussion and Analysis of Financial Condition and Results of Operations” of this Form 10-K.
Risks Related to Our Business and Properties
The majority of our infrastructure real property assets are leased to a single tenant.
The Pinedale LGS represented approximately 78 percent of our total assets as of December 31, 2013 and the lease payments under the Pinedale Lease Agreement with Ultra Wyoming represented approximately 64 percent of our total revenue as of December 31, 2013. Ultra Wyoming or Ultra Petroleum, one of the guarantors of Ultra Wyoming’s obligations under the Pinedale Lease Agreement and Ultra Wyoming’s ultimate parent company, may experience a downturn in its business, which may weaken its financial condition and result in Ultra Wyoming’s failure to make timely lease payments or give rise to default under the Pinedale Lease Agreement or Ultra Petroleum’s failure to meet its related parent guaranty obligations. In the event of a default by Ultra Wyoming or Ultra Petroleum, we may experience delays in enforcing our rights as landlord and may incur substantial costs in protecting our investment. In addition, if Ultra Wyoming fails to renew the Pinedale Lease Agreement and we cannot find a new lessee at the same or better lease rates, the expiration of the Pinedale Lease Agreement in fifteen years could have a material adverse impact on our business and financial condition.
The following is a brief summary of certain risk factors disclosed by Ultra Petroleum in its most recent Annual Report on Form 10-K, which should be carefully considered before you decide to invest in shares of our common stock. For a complete discussion of the risks that may be applicable to Ultra Petroleum, please review its complete Annual Report on Form 10-K for the fiscal year ended December 31, 2013.
| |
• | Ultra Petroleum’s reserve estimates may turn out to be incorrect if the assumptions upon which these estimates are based are inaccurate. Any material inaccuracies in these reserve estimates or underlying assumptions will materially affect the quantities and present value of Ultra Petroleum’s reserves. |
| |
• | Competitive industry conditions may negatively affect Ultra Petroleum’s ability to conduct operations. |
| |
• | Factors beyond Ultra Petroleum’s control may affect its ability to effectively market production and may ultimately affect its financial results. |
| |
• | A decrease in oil and natural gas prices may adversely affect Ultra Petroleum’s results of operations and financial condition. |
| |
• | A substantial portion of Ultra Petroleum's reserves and production is natural gas. Prices for natural gas have been lower in recent years than at various times in the past and may remain lower in the future. Sustained low prices for natural gas may also adversely affect Ultra Petroleum's operational and financial condition. |
| |
• | Compliance with environmental and other governmental regulations could be costly and could negatively impact Ultra Petroleum’s production. |
| |
• | Climate change legislation or regulations restricting emissions of “greenhouse gases” could result in increased operating costs and reduced demand for the oil and gas that Ultra Petroleum produces. |
| |
• | Cyber-attacks targeting systems and infrastructure used by the oil and gas industry may adversely impact our operations. |
| |
• | Ultra Petroleum may not be able to replace its reserves or generate cash flows if it is unable to purchase or raise capital. Ultra Petroleum will be required to make substantial capital expenditures to develop its existing reserves and to discover new oil and natural gas reserves. |
| |
• | Ultra Petroleum’s operations may be interrupted by severe weather or drilling restrictions. |
| |
• | Ultra Petroleum is exposed to operating hazards and uninsured risks that could adversely impact its results of operations and cash flows. |
| |
• | If oil and gas prices decrease, Ultra Petroleum may be required to write down the carrying value of its oil and natural gas properties. |
We are subject to risks associated with ownership of our significant assets.
Our ownership of the Pinedale LGS subjects us to all of the inherent hazards and risks normally incidental to the transmission, storage and distribution of natural gas and natural gas liquids, such as well site blowouts, cratering and explosions, pipe and other equipment and system failures, uncontrolled flows of natural gas or well fluids, fires, formations with abnormal pressures, pollution and environmental risks and natural disasters. Further, our ownership of the Portland Terminal Facility will subject us to all of the inherent hazards and risks normally incidental to the storage and distribution of crude oil and petroleum products, such as fires, explosions, leaks or hazardous materials releases, disruptions in supply infrastructure or logistics and other equipment failures, pollution and environmental risks and disasters. These risks could result in substantial losses due to personal injury and/or loss of life, significant damage to and destruction of property and equipment and pollution or other environmental damage. Moreover, if one or more of these hazards occur, there can be no assurance that a response will be adequate to limit or reduce damage. As a result of these risks, we may also sometimes be a defendant in legal proceedings and litigation arising in the ordinary course of business. While the terms of the lease agreements may require the tenant to bear the cost of all insurance coverage (which is currently not material), there can be no assurance that the insurance policies that we maintain to limit our liability for such losses will be adequate to protect us from all material expenses related to potential future claims for personal injury and property damage or that such levels of insurance will be available in the future at economical prices or to cover all risks. The Terrorism Risk Insurance Act of 2002 is designed for a sharing of terrorism losses between insurance companies and the federal government, and has been renewed until December 31, 2014. We cannot be certain how this will impact us or what additional cost to us or our tenants, if any, could result.
We are subject to the risk of Ultra Wyoming transferring its obligations under the Pinedale Lease Agreement.
The terms of the Pinedale Lease Agreement provide that Ultra Wyoming may transfer its rights and obligations under the Pinedale Lease Agreement at any time, subject to certain conditions. We thus bear the risk that Ultra Wyoming will transfer its rights and obligations under the Pinedale Lease Agreement to a third party whose creditworthiness may not be on par with that of Ultra Wyoming, which could inhibit such transferee’s ability to make timely lease payments under the Pinedale Lease Agreement or increase the likelihood that a downturn in the business of such transferee could give rise to a default under the Pinedale Lease Agreement. The occurrence of either of these events could have a material adverse impact on our business and financial condition.
Our operations could be adversely affected if third-party pipelines, railraods or other facilities interconnected to our facilities become partially or fully unavailable.
Our facilities connect to other pipelines, railroads or facilities owned by third parties. The continuing operation of such third-party pipelines, railroads or facilities is not within our control. These pipelines and other facilities may become unavailable, or available only at a reduced capacity. If any of these third-party pipelines or facilities becomes unable to transport the products distributed or transported through our facilities, our business, results of operations, financial condition and ability to make cash distributions to our stockholders could be adversely affected.
The terms of the co-investment in Pinedale LP may limit our ability to take certain actions in the future.
Pinedale GP, our wholly-owned subsidiary, is the general partner of Pinedale LP. Under the Pinedale LP partnership agreement, Pinedale GP is given broad authority to manage the affairs of Pinedale LP and to ensure that Pinedale LP complies with the terms of various agreements to which it is a party, including the Pinedale Lease Agreement and the credit agreement with KeyBank. The Pinedale LP partnership agreement, however, requires the approval of the holder of a majority of a class of limited partner interests (all of which are currently held by Prudential) before certain actions can be taken by Pinedale LP, including granting any consent under the Pinedale Lease Agreement to: extend the term of the Pinedale Lease Agreement; change the methodology of determining the rent; improve the leased property; reduce the present value of rental payments; merge with, or acquire unrelated assets from, a third party; incur debt, or amend the terms of any existing Pinedale LP debt, that would increase that debt above a specified amount; or issue partnership interests with rights superior to those held initially by Prudential. The approval of one or more of the foregoing matters may not be obtained at a time when we believe that an action requiring approval should be taken.
We are subject to risks involved in single tenant leases.
We intend to focus our acquisition activities on real properties that are triple net-leased to single tenants. Therefore, the financial failure of, or other default by, a single tenant under its lease: (i) is likely to cause a significant reduction in the operating cash flow generated by the property leased to that tenant, (ii) might decrease the value of that property, and (iii) will expose us to 100 percent of all applicable operating costs.
As owners of the Portland Terminal Facility, we may incur significant costs and liabilities in complying with environmental, health and safety laws and regulations, which are complex and frequently changing.
The operations at the Portland Terminal Facility involve the storage and throughput of crude oil, petroleum products and chemicals and are subject to federal, state, and local laws and regulations governing, among other things, the gathering, storage, handling, and transportation of petroleum and hazardous substances, the emission and discharge of materials into the environment, the generation, management and disposal of wastes, and other matters otherwise relating to the protection of the environment. The operations at the Portland Terminal Facility are also subject to various laws and regulations relating to occupational health and safety. Moreover, the operations at the Portland Terminal Facility are inherently subject to accidental spills, discharges or other releases of petroleum or hazardous substances into the environment and neighboring areas, for which we may incur substantial liabilities, including those to investigate and remediate. Failure to comply with applicable environmental, health, and safety laws and regulations may result in the assessment of sanctions, including administrative, civil or criminal penalties, permit revocations, and injunctions limiting or prohibiting some or all of the operations at the Portland Terminal Facility.
The financial condition of Arc Terminals and Arc Logistics and the ability and willingness of each to satisfy its obligations under the Portland Lease Agreement and the related parent guaranty will have a material impact on our results of operation, ability to service our indebtedness and ability to make distributions.
Arc Terminals, or Arc Logistics, the guarantor of Arc Terminals’ obligations under the Portland Lease Agreement, may experience a downturn in its business. If Arc Logistics identifies appropriate acquisition candidates, it may be unable to negotiate successfully the terms of the acquisitions, finance them, or integrate the acquired business into its then existing business. Completing an acquisition and integrating an acquired business may require a significant diversion of Arc Terminals’ management time and resources and involve significant costs. If Arc Terminals makes one or more significant acquisitions in which the consideration includes cash, Arc Terminals could be required to use a substantial portion of its available cash, or obtain financing, in order consummate such acquisitions. Any of the above may weaken Arc Terminals’ or Arc Logistics’ financial condition and result in Arc Terminals’ failure to make timely lease payments or give rise to another default under the Portland Lease Agreement or Arc Logistics’ failure to meet its related parent guaranty obligations. Further, Arc Terminals or Arc Logistics could be subject to a bankruptcy proceeding pursuant to Title 11 of the bankruptcy laws of the United States.
In the event of any of the above by Arc Terminals or Arc Logistics, we may experience delays in enforcing our rights as landlord and may incur substantial costs in protecting our investment. The financial condition of Arc Terminals and Arc Logistics and the ability and willingness of each to satisfy its obligations under the Portland Lease Agreement and the related parent guaranty will have a material impact on our results of operation, ability to service our indebtedness and ability to make distributions. In addition, if Arc Terminals fails to renew the Portland Lease Agreement and we cannot find a new lessee at the same or better lease rates, the expiration of the Portland Lease Agreement in fifteen years could have a material adverse impact on our business and financial condition.
Risks Related to Our Financing Arrangements
Our indebtedness could have important consequences, including impairing our ability to obtain additional financing or pay future distributions, as well as subjecting us to the risk of foreclosure on any mortgaged properties in the event of non-payment of the related debt.
As of December 31, 2013, we had outstanding consolidated indebtedness of approximately $70 million. Our leverage could have important consequences. For example, it could:
| |
• | result in the acceleration of a significant amount of debt for non-compliance with the terms of such debt or, if such debt contains cross-default or cross-acceleration provisions, other debt; |
| |
• | materially impair our ability to borrow undrawn amounts under existing financing arrangements or to obtain additional financing or refinancing on favorable terms or at all; |
| |
• | require us to dedicate a substantial portion of our cash flow to paying principal and interest on our indebtedness, thereby reducing the cash flow available to fund our business, to pay distributions, including those necessary to maintain REIT qualification, or to use for other purposes; |
| |
• | increase our vulnerability to economic downturns; |
| |
• | limit our ability to withstand competitive pressures; or |
| |
• | reduce our flexibility to respond to changing business and economic conditions. |
Further, we expect to mortgage many of our properties to secure payment of indebtedness. If we are unable to meet mortgage payments, such failure could result in the loss of assets due to foreclosure and transfer to the mortgagee or sale on unfavorable terms with a consequent loss of income and asset value. A foreclosure of one or more of our properties could create taxable income without accompanying cash proceeds, and could adversely affect our financial condition, results of operations, cash flow, and ability to service debt and make distributions and the market price of our stock.
We may not be able to refinance the indebtedness that we incurred to fund the acquisition of the Pinedale LGS.
Pinedale LP borrowed $70 million under its credit facility to finance the acquisition of the Pinedale LGS and such indebtedness will mature in 2015 or 2016, if the option to extend the date of maturity is exercised. Pinedale LP may not be able to refinance that indebtedness on its existing terms or at all. If funding is not available when needed, or is available only on unfavorable terms, we may not be able to meet our obligations as they come due. Moreover, without adequate funding, we may be unable to execute our growth strategies, complete future acquisitions, take advantage of other business opportunities or respond to competitive pressures, any of which could have a material adverse effect on our revenues and results of operations.
We face risks associated with our dependence on external sources of capital.
In order to qualify as a REIT, we are required each year to distribute to our stockholders at least 90 percent of our REIT taxable income, and we will be subject to tax on our income to the extent it is not distributed. Because of this distribution requirement, we may not be able to fund all future capital needs from cash retained from operations. As a result, to fund capital needs, we must rely on third-party sources of capital, which we may not be able to obtain on favorable terms, if at all. Our access to third-party sources of capital depends upon a number of factors, including (i) general market conditions; (ii) the market’s perception of our growth potential; (iii) our current and potential future earnings and cash distributions; and (iv) the market price of our capital stock. Additional debt financing may substantially increase our debt-to-total capitalization ratio. Additional equity issuances may dilute the holdings of our current stockholders.
Covenants in our loan documents could limit our flexibility and adversely affect our financial condition.
The terms of our various credit agreements and other indebtedness require us to comply with a number of customary financial and other covenants, such as maintaining debt service coverage and leverage ratios and maintaining insurance coverage. These covenants may limit our flexibility in our operations, and breaches of these covenants could result in defaults under the instruments governing the applicable indebtedness even if we had satisfied our payment obligations. If we were to default under credit agreements or other debt instruments, our financial condition would be adversely affected.
We face risks related to “balloon payments” and refinancings.
Certain of our mortgages will have significant outstanding principal balances on their maturity dates, commonly known as “balloon payments.” There can be no assurance that we will be able to refinance the debt on favorable terms or at all. To the extent we cannot refinance this debt on favorable terms or at all, we may be forced to dispose of properties on disadvantageous terms or pay
higher interest rates, either of which would have an adverse impact on our financial performance and ability to service debt and make distributions.
Risks Related to REIT Qualification and Federal Income Tax Laws
We have elected to be taxed as a REIT for fiscal 2013, but the IRS may challenge our qualification as a REIT.
We have elected to be a REIT for federal income tax purposes. In order to qualify as a REIT, a substantial percentage of our income must be derived from, and our assets consist of, real estate assets, and, in certain cases, other investment property. We have acquired and managed investments which satisfy the REIT tests. Whether a particular investment is considered a real estate asset for such purposes depends upon the facts and circumstances of the investment. Due to the factual nature of the determination, the IRS may challenge whether any particular investment will qualify as a real estate asset or realize income which satisfies the REIT income tests. In determining whether an investment is a real property asset, we will look at the Code and the IRS’s interpretation of the Code in regulations, published rulings, private letter rulings and other guidance. In the case of a private letter ruling issued to another taxpayer, we would not be able to bind the IRS to the holding of such ruling. If the IRS successfully challenges our qualification as a REIT we may not be able to achieve our objectives and the value of our stock may decline. As a REIT, our distributions from earnings and profits will be treated as ordinary income and a return of capital, and generally will not qualify as QDI. To the extent that the REIT had accumulated C corporation earnings and profits from the periods prior to 2013, we have distributed such earnings and profits in 2013, which have been treated as QDI.
Although we believe that the Pinedale LGS and the Portland Terminal Facility constitute real estate assets for tax purposes, that belief is not binding on the Internal Revenue Service or any court and does not guarantee our qualification as a REIT.
In 2007, 2009 and 2010, the IRS issued three separate private letter rulings that confirmed certain energy infrastructure assets as real estate assets for tax purposes. The potential qualifying real estate assets in the energy infrastructure sector include electric transmission and distribution systems, pipeline systems, and storage and terminalling systems. We believe that the Pinedale LGS and Portland Terminal Facility constitute a real estate assets for tax purposes consistent with these private letter rulings. Although private letter rulings provide insight into the current thinking of the IRS on tax issues, such rulings may only be relied upon by the taxpayer to whom they were issued and are not binding on the IRS with respect to us, the Pinedale LGS or the Portland Terminal Facility. We have not obtained any private letter rulings with respect to the Pinedale LGS or the Portland Terminal Facility. If the Pinedale LGS does not constitute a real estate asset for federal income tax purposes, we would likely fail to qualify as a REIT, would not achieve our objectives and the value of our stock could decline.
As a newly-elected REIT, we are subject to a corporate level tax on certain built in gains if certain assets are sold during the 10 year period following such election.
Generally, a REIT is treated as a flow-through entity for federal income tax purposes, as a REIT’s income is generally subject to a single level of federal taxation, which is accomplished by the REIT annually distributing at least ninety percent of its REIT taxable income.
However, through 2022, we will be subject to a REIT level federal income tax on any built-in gain recognized during such period. We do not anticipate any significant built-in gain. If a REIT satisfies the minimum distribution requirement, it generally is entitled to a deduction for dividends paid. The REIT stockholders are then required to report the REIT dividend as ordinary income. A REIT stockholder’s receipt of dividends generally will not qualify as qualified dividend income or for the dividends received deduction discussed above. Thus, as a REIT, we are more favorably treated for federal income tax purposes than under our prior taxation as a C corporation.
In order to remain qualified as a REIT, we are required to satisfy gross income and asset tests. Generally, such tests require that a substantial percentage of the REIT’s income be derived from, and assets consist of, real estate assets, and, in certain cases, other investment property. This is a factual determination that we generally will have to make annually with respect to the income tests and quarterly with respect to the asset tests.
There are uncertainties relating to the estimate of our anticipated special distribution.
To qualify for taxation as a REIT, we were required to distribute to our stockholders all of our pre-REIT accumulated earnings and profits, if any, as measured for federal income tax purposes, prior to the end of 2013. Failure to make the special distribution could result in our disqualification for taxation as a REIT. The determination of the timing and amount to be distributed in the special distribution is a complex factual and legal determination. We may interpret the applicable law differently than the IRS. We believe and intend that our distributions did satisfy the requirements relating to the distribution of our pre-REIT accumulated earnings and profits. There are, however, substantial uncertainties relating to the computation of our distribution, including the possibility that the IRS could, in auditing tax years prior to our REIT election, successfully assert that our taxable income should be increased, which could increase our pre-REIT accumulated earnings and profits. Thus, we may have failed to satisfy the
requirement that we distribute all of our pre-REIT accumulated earnings and profits by the close of 2013. Moreover, although there are procedures available to cure a failure to distribute all of our pre-REIT accumulated earnings and profits, we cannot now determine whether we will be able to take advantage of them or the economic impact to us of doing so.
Failure to qualify as a REIT would have significant adverse consequences to us and the value of our common stock.
For 2013, we believe our income and investments allowed us to meet the income and asset tests necessary for us to qualify for and we have elected to be taxed as a REIT for fiscal 2013. Qualification as a REIT involves the application of highly technical and complex provisions of the Internal Revenue Code as to which there may only be limited judicial and administrative interpretations and involves the determination of facts and circumstances not entirely within our control. Future legislation, new regulations, administrative interpretations or court decisions may significantly change the tax laws or the application of the tax laws with respect to qualification as a REIT for federal income tax purposes or the federal income tax consequences of such qualification. Accordingly, we cannot assure you that we will be organized or will operate to qualify as a REIT for future fiscal years. If, with respect to any taxable year, we fail to qualify as a REIT, we would not be allowed to deduct distributions to stockholders in computing our taxable income. After our initial election and qualification as a REIT, if we later failed to so qualify and we were not entitled to relief under the relevant statutory provisions, we would also be disqualified from treatment as a REIT for four subsequent taxable years. If we fail to qualify as a REIT, corporate-level income tax, including any applicable alternative minimum tax, would apply to our taxable income at regular corporate rates. As a result, the amount available for distribution to holders of equity securities would be reduced for the year or years involved, and we would no longer be required to make distributions. In addition, our failure to qualify as a REIT could impair our ability to expand our business and raise capital, and it could adversely affect the value of our common stock.
The ability of stockholders to control our policies and effect a change of control of our company will be limited by certain provisions of our articles of incorporation and by Maryland law.
Our articles of incorporation authorize our board of directors to amend our charter to increase or decrease the aggregate number of authorized shares of stock, to authorize us to issue additional shares of our common stock or preferred stock and to classify or reclassify unissued shares of our common stock or preferred stock and thereafter to authorize us to issue such classified or reclassified shares of stock. We believe that these provisions in our articles of incorporation will provide us with increased flexibility in structuring possible future financings and acquisitions and in meeting other needs that might arise. The additional classes or series, as well as the additional authorized shares of common stock, will be available for issuance without further action by our stockholders, unless such action is required by applicable law or the rules of any stock exchange or automated quotation system on which our securities may be listed or traded. Although our board of directors does not currently intend to do so, it could authorize us to issue a class or series of stock that could, depending upon the terms of the particular class or series, delay, defer or prevent a transaction or a change of control of our company that might involve a premium price for holders of our common stock or that our common stockholders otherwise believe to be in their best interests.
To maintain our qualification as a REIT for U.S. federal income tax purposes, our articles of incorporation have been amended so that not more than 50 percent in value of our outstanding stock may be owned, directly or indirectly, by or for five or fewer individuals (as defined in the Internal Revenue Code to include certain entities such as private foundations) at any time during the last half of any taxable year. Our articles generally prohibit any individual (as defined under the Internal Revenue Code to include certain entities) from actually owning or being deemed to own by virtue of the applicable constructive ownership provisions of the Internal Revenue Code, (i) more than 9.8 percent (in value or in number of shares, whichever is more restrictive) of the issued and outstanding shares of our common stock or (ii) more than 9.8 percent in value of the aggregate of the outstanding shares of all classes and series of our stock, in each case, excluding any shares of our stock not treated as outstanding for federal income tax purposes. Subject to the exceptions described below, our articles of incorporation further prohibit any person or entity from actually or constructively owning shares in excess of these limits. We refer to these restrictions as the “ownership limitation provisions.” These ownership limitation provisions may prevent or delay a change in control and, as a result, could adversely affect our stockholders’ ability to realize a premium for their shares of common stock. However, upon request, our board of directors may waive the ownership limitation provisions with respect to a particular stockholder and establish different ownership limitation provisions for such stockholder. In granting such waiver, our board of directors may also require the stockholder receiving such waiver to make certain representations, warranties and covenants related to our ability to qualify as a REIT.
Complying with the REIT requirements may cause us to forgo otherwise attractive opportunities or liquidate certain of our investments.
To remain a REIT for U.S. federal income tax purposes, we must continually satisfy tests concerning, among other things, the sources of our income, the nature and diversification of our assets, the amounts we distribute to our stockholders and the ownership of our stock. We may be required to make distributions to our stockholders at disadvantageous times or when we do not have funds readily available for distribution. Thus, compliance with the REIT requirements may hinder our ability to make certain otherwise attractive investments or undertake other activities that might otherwise be beneficial to our company and our
stockholders, or may require us to borrow or liquidate investments in unfavorable market conditions. In addition, Corridor may be unable to find investments that comply with REIT requirements, thereby limiting our ability to grow or even maintain our asset base.
In connection with such REIT requirements, we must ensure that, at the end of each calendar quarter, at least 75 percent of the value of our assets consists of cash, cash items, government securities and qualified real property assets. The remainder of our investments in securities (other than cash, cash items, government securities, securities issued by a REIT taxable subsidiary or certain other qualified assets) generally cannot include more than 10 percent of the outstanding voting securities of any one issuer or more than 10 percent of the total value of the outstanding securities of any one issuer. In addition, in general, no more than 5 percent of the value of our total assets (other than cash, cash items, government securities, certain other securities and qualified real property assets) can consist of the securities of any one issuer, and no more than 25 percent of the value of our total securities can be represented by securities of one or more of a certain class of issuers. After meeting these requirements at the close of a calendar quarter, if we fail to comply with these requirements at the end of any subsequent calendar quarter, we must correct the failure within 30 days after the end of the calendar quarter or qualify for certain statutory relief provisions to avoid losing our REIT qualification. As a result, we may be required to liquidate from our portfolio otherwise attractive investments. These actions could have the effect of reducing our income and amounts available for distribution to our stockholders.
As a REIT, re-characterization of sale-leaseback transactions may cause us to lose our REIT status.
We intend to purchase properties and simultaneously lease the same property back to the seller of such properties. While we will use our best efforts to structure any such sale-leaseback transaction so that the lease will be characterized as a “true lease,” thereby allowing us to be treated as the owner of the property for U.S. federal income tax purposes, the IRS could challenge such characterization. In the event that any sale-leaseback transaction is recharacterized as a financing transaction or loan for U.S. federal income tax purposes, deductions for depreciation and cost recovery relating to such property would be disallowed. If a sale-leaseback transaction were so recharacterized, we might fail to satisfy the REIT qualification “asset tests” or the “income tests” and, consequently, lose our REIT status effective with the year of re-characterization. Alternatively, the amount of our REIT taxable income could be recalculated which might also cause us to fail to meet the distribution requirement for a taxable year.
As a REIT, we are required to make distributions, other than capital gain distributions, to our stockholders each year in the amount of at least 90 percent of our REIT taxable income As a result, we will continue to need additional capital to make new investments. If additional funds are unavailable or not available on favorable terms, our ability to make new investments will be impaired.
As a REIT, we are required to distribute at least 90 percent of our REIT taxable income, and as such we may require additional capital to make new investments or carry existing investments. We may acquire additional capital from the issuance of securities senior to our common stock, including additional borrowings or other indebtedness or the issuance of additional securities. We may also acquire additional capital through the issuance of additional equity. However, we may not be able to raise additional capital in the future on favorable terms or at all. Unfavorable economic conditions could increase our funding costs, limit our access to the capital markets or result in a decision by lenders not to extend credit to us. We may issue debt securities, other instruments of indebtedness or preferred stock, and we borrow money from banks or other financial institutions, which we refer to collectively as “senior securities.” As a result of issuing senior securities, we will also be exposed to typical risks associated with leverage, including increased risk of loss. If we issue preferred securities which will rank “senior” to our common stock in our capital structure, the holders of such preferred securities may have separate voting rights and other rights, preferences or privileges more favorable than those of our common stock, and the issuance of such preferred securities could have the effect of delaying, deferring or preventing a transaction or a change of control that might involve a premium price for security holders or otherwise be in our best interest.
To the extent our ability to issue debt or other senior securities is constrained, we will depend on issuances of additional common stock to finance new investments. If we raise additional funds by issuing more of our common stock or senior securities convertible into, or exchangeable for, our common stock, the percentage ownership of our stockholders at that time would decrease, and you may experience dilution.
Risks Related to Our Corporate Structure and Governance
The ability of our board of directors to revoke our REIT qualification or alter our business policies without stockholder approval may cause adverse consequences to our stockholders.
Our Board of Directors determines our growth, investment, financing, capitalization, borrowing, REIT status, operations and distributions policies. Although our Board of Directors has no present intention to amend or reverse any of these policies, they may be amended or revised without notice to stockholders. We cannot assure you that any changes in our policies will serve fully the interests of all stockholders. In particular, our articles of incorporation provide that our board of directors may revoke or otherwise terminate our REIT election, without the approval of our stockholders, if it determines that it is no longer in our best
interest to continue to qualify as a REIT. If we cease to be a REIT, we will not be allowed a deduction for dividends paid to stockholders in computing our taxable income and will be subject to U.S. federal income tax at regular corporate rates and state and local taxes, which may have adverse consequences on our total return to our stockholders.
Corridor may serve as a manager to other entities, which may create conflicts of interest not in the best interest of us or our stockholders.
Corridor’s services under the Management Agreement are not exclusive, and, while it currently does not have any contractual arrangement to do so, it is free to furnish the same or similar services to other entities, including businesses that may directly or indirectly compete with us so long as its services to us are not impaired by the provision of such services to others. Corridor and its members may have obligations to other entities, the fulfillment of which might not be in the best interests of us or our stockholders.
We will be dependent upon key personnel of Corridor for our future success.
We have entered into a management agreement with Corridor to provide full management services to us for real property asset investments. We will be dependent on the diligence, expertise and business relationships of the management of Corridor to implement our strategy of acquiring real property assets. The departure of one or more investment professionals of Corridor could have a material adverse effect on our ability to implement this strategy and on the value of our common stock. There can be no assurance that we will be successful in implementing our strategy.
Provisions of the Maryland General Corporation Law and our charter and bylaws could deter takeover attempts and have an adverse impact on the price of our common stock.
The following considerations related to provisions of Maryland General Corporation Law, and of our charter and bylaws, may have the effect of discouraging, delaying or making difficult a change in control of our Company or the removal of our incumbent directors:
| |
• | We are subject to the Business Combination Act of the Maryland General Corporation Law. However, pursuant to the statute, our Board of Directors has adopted a resolution exempting us from the Maryland Business Combination Act for any business combination between us and any person to the extent that such business combination receives the prior approval of our board. |
| |
• | Our Bylaws exempt from the Maryland Control Share Acquisition Act acquisitions of stock by any person. If we amend our Bylaws to repeal the exemption from the Maryland Control Share Acquisition Act, the Maryland Control Share Acquisition Act also may make it more difficult to obtain control of our Company. |
| |
• | Under our charter, our Board of Directors is divided into three classes serving staggered terms, which will make it more difficult for a hostile bidder to acquire control of us. |
| |
• | In addition, our Board of Directors may, without stockholder action, authorize the issuance of shares of stock in one or more classes or series, including preferred stock. Our Board of Directors also may, without stockholder action, amend our charter to increase the number of shares of stock of any class or series that we have authority to issue. |
The existence of these provisions, among others, may have a negative impact on the price of our common stock and may discourage third party bids for ownership of our Company. These provisions may prevent any premiums being offered to you for our common stock.
Risks Related to Our Non-Real Estate Investments
Our securities investments in privately-held companies present certain challenges, including availability of information about these companies and illiquidity that may impact our ability to liquidate these investments in a timely and/or advantageous manner.
We currently have securities investments in privately-held companies. Generally, little public information exists about these companies. If we are unable to obtain all material information about these companies, including with respect to operational, regulatory, environmental, litigation and managerial risks, we may not make a fully-informed investment decision, and we may lose some or all of the money invested in these companies. Substantially all of these securities are subject to legal and other restrictions on resale or are otherwise less liquid than publicly traded securities. The illiquidity of these investments may make it difficult for us to sell such investments at advantageous times and prices or in a timely manner. In addition, if we are required to liquidate all or a portion of our securities portfolio quickly, we may realize significantly less than the value at which we previously have recorded our investments. We also may face other restrictions on our ability to liquidate an investment in the securities of a portfolio company to the extent that we or one of our affiliates have material non-public information regarding such portfolio company.
All of our securities investments are, and will continue to be, recorded at fair value. Because such valuations are inherently uncertain, our determinations of fair value may differ materially from the values that would have been used if a ready market for these securities existed.
We continue to hold investments that are in the form of securities or loans that are not publicly traded. The fair value of these investments may not be readily determinable. For securities investments that are reported at fair value, we will value these investments quarterly at fair value. We have retained an independent valuation firm to provide third-party valuation consulting services. The Audit Committee is ultimately responsible for determining the fair value of the investments in good faith. The types of factors that may be considered in fair value pricing of an investment include the nature and realizable value of any collateral, the portfolio company’s earnings and ability to make payments, the markets in which the portfolio company does business, comparison to publicly traded companies, discounted cash flow and other relevant factors. Because such valuations are inherently uncertain, our determinations of fair value may differ materially from the values that would have been used if a ready market for these securities existed. As a result, we may not be able to dispose of our holdings at a price equal to or greater than the determined fair value, which could have a negative impact on our net equity and earnings.
The lack of liquidity in our securities investments may make it difficult to liquidate our securities portfolio at favorable prices, and as a result, we may suffer losses.
We have historically invested in the equity of companies whose securities are not publicly traded, and whose securities may be subject to legal and other restrictions on resale or otherwise be less liquid than publicly-traded securities. As of December 31, 2013 all of our securities investments were invested in illiquid securities. The illiquidity of these investments may make it difficult for us to sell these investments when desired. In addition, we may realize significantly less than the value at which we had previously recorded these investments when we liquidate our securities portfolio. The illiquidity of most of our securities investments may make it difficult for us to dispose of them at favorable prices, and, as a result, we may suffer losses.
If our acquisitions do not meet our performance expectations, you may not receive distributions.
We intend to make distributions on a quarterly basis to our stockholders out of assets legally available for distribution. We may not be able to achieve operating results that will allow us to make distributions at a specific level or to increase the amount of these distributions from time to time. Also, restrictions and provisions in any credit facilities we enter into or debt securities we issue may limit our ability to make distributions. We cannot assure you that you will receive distributions at a particular level or at all.
If we were deemed an investment company under the Investment Company Act of 1940, applicable restrictions could make it impractical for us to continue our business as contemplated and could have a material adverse effect on our business and the price of our securities.
We do not believe that we are an investment company under the 1940 Act. If during the period in which we are liquidating our securities portfolio we make an investment in securities, or one of our infrastructure real property asset acquisitions were characterized as an investment in securities, we could be deemed an investment company for purposes of the 1940 Act. If we were to be deemed an investment company, restrictions imposed by the 1940 Act, including limitations on our capital structure, could make it impractical for us to continue our business as contemplated and would have a material adverse effect on our operations and the price of our common stock.
Changes in laws or regulations or in the interpretations of laws or regulations could significantly affect our operations and cost of doing business.
We are subject to federal, state and local laws and regulations and are subject to judicial and administrative decisions that affect our operations, including loan originations, maximum interest rates, fees and other charges, disclosures to equity investees the terms of secured transactions, collection and foreclosure procedures and other trade practices. If these laws, regulations or decisions change, we may have to incur significant expenses in order to comply, or we may have to restrict our operations. In addition, if we do not comply with applicable laws, regulations and decisions, or fail to obtain licenses that may become necessary for the conduct of our business, we may be subject to civil fines and criminal penalties, any of which could have a material adverse effect upon our business, results of operations or financial condition.
Risks Related to Investments in Real Estate and the U.S. Energy Infrastructure Sector
We may be unable to identify and complete acquisitions of real property assets.
Our ability to identify and complete acquisitions of real property assets on favorable terms and conditions are subject to the following risks:
| |
• | we may be unable to acquire a desired asset because of competition from other investors with significant capital, including both publicly traded and non-traded REITs and institutional investment funds; |
| |
• | competition from other investors may significantly increase the purchase price of a desired real property asset or result in less favorable terms; |
| |
• | we may not complete the acquisition of a desired real property asset even if we have signed an agreement to acquire such real property asset because such agreements are subject to customary conditions to closing, including completion of due diligence investigations to our satisfaction; |
| |
• | we may be unable to finance acquisitions of real property assets on favorable terms or at all. |
Net leases may not result in fair market lease rates over time.
We expect a large portion of our future income to come from net leases. Net leases typically have longer lease terms and, thus, there is an increased risk that if market rental rates increase in future years, the rates under our net leases will be less than fair market rental rates during those years. As a result, our income and distributions could be lower than they would otherwise be if we did not engage in net leases. We generally will seek to include a clause in each lease that provides increases in rent over the term of the lease, but there can be no assurance we will be successful in obtaining such a clause.
Some losses related to our real property assets, including, among others, losses related to potential terrorist activities, may not be covered by insurance and would adversely impact distributions to stockholders.
Our leases will generally require the tenant companies to carry comprehensive liability and casualty insurance on our properties comparable in amounts and against risks customarily insured against by other companies engaged in similar businesses in the same geographic region as our tenant companies. We believe the required coverage will be of the type, and amount, customarily obtained by an owner of similar properties. However, there are some types of losses, such as catastrophic acts of nature, acts of war or riots, for which we or our tenants cannot obtain insurance at an acceptable cost. If there is an uninsured loss or a loss in excess of insurance limits, we could lose both the revenues generated by the affected property and the capital we have invested in the property if our tenant company fails to pay us the casualty value in excess of such insurance limit, if any, or to indemnify us for such loss. This would in turn reduce the amount of income available for distributions. We would, however, remain obligated to repay any secured indebtedness or other obligations related to the property. Since September 11, 2001, the cost of insurance protection against terrorist acts has risen dramatically. The cost of coverage for acts of terrorism is currently mitigated by the Terrorism Risk Insurance Act (“TRIA”). If TRIA is not extended beyond its current expiration date of December 31, 2014, our tenants may incur higher insurance costs and greater difficulty in obtaining insurance that covers terrorist-related damages. There can be no assurance our tenant companies will be able to obtain terrorism insurance coverage, or that any coverage they do obtain will adequately protect our properties against loss from terrorist attack.
If a sale-leaseback transaction is re-characterized in a lessee company’s bankruptcy proceeding, our financial condition could be adversely affected.
We intend to enter into sale-leaseback transactions, whereby we purchase a property and then simultaneously lease the same property back to the seller. In the event of the bankruptcy of a lessee company, a transaction structured as a sale-leaseback may be re-characterized as either a financing or a joint venture, either of which outcomes could adversely affect our business.
If the sale-leaseback were re-characterized as a financing, we might not be considered the owner of the property, and as a result would have the status of a creditor in relation to the lessee company. In that event, we would no longer have the right to sell or encumber our ownership interest in the property. Instead, we would have a claim against the lessee company for the amounts owed under the lease, with the claim arguably secured by the property. The lessee company/debtor might have the ability to restructure the terms, interest rate and amortization schedule of its outstanding balance. If confirmed by the bankruptcy court, we could be bound by the new terms, and prevented from foreclosing our lien on the property. If the sale-leaseback were re-characterized as a joint venture, we and the lessee company could be treated as co-venturers with regard to the property. As a result, we could be held liable, under some circumstances, for debts incurred by the lessee company relating to the property. Either of these outcomes could adversely affect our cash flow and the amount available for distribution.
We may not be able to sell our real property asset investments when we desire.
Investments in real property assets are relatively illiquid compared to other investments. Accordingly, we may not be able to sell real property asset investments when we desire or at prices acceptable to us in response to changes in economic or other conditions. This could substantially reduce the funds available for satisfying our obligations and for distribution to our stockholders.
Costs of complying with governmental laws and regulations, including those relating to environmental matters, may adversely affect our income and the cash available for distribution.
We have invested, and expect to continue to invest, in real property assets, which are subject to laws and regulations relating to the protection of the environment and human health and safety. These laws and regulations generally govern wastewater discharges, air emissions, the operation and removal of underground and aboveground storage tanks, the use, storage, treatment, transportation and disposal of solid and hazardous materials, and the remediation of contamination associated with disposals. Environmental laws and regulations may impose joint and several liability on tenants, owners or operators for the costs to investigate or remediate contaminated properties, regardless of fault or whether the acts causing the contamination were legal. This liability could be substantial. In addition, the presence of hazardous substances, or the failure to properly remediate these substances, may adversely affect our ability to sell, rent or pledge such property as collateral for future borrowings.
Some of these laws and regulations have been amended so as to require compliance with new or more stringent standards as of future dates. Compliance with new or more stringent laws or regulations or stricter interpretation of existing laws may require material expenditures by us. Future laws, ordinances or regulations may impose material environmental liability. Additionally, our tenant companies’ operations, the existing condition of land when we buy it, operations in the vicinity of our properties, such as the presence of underground storage tanks, or activities of unrelated third parties may affect our properties. In addition, there are various local, state and federal fire, health, life-safety and similar regulations with which we may be required to comply, and that may subject us to liability in the form of fines or damages for noncompliance. Any material expenditures, fines, or damages we must pay will reduce our ability to make distributions.
State and federal laws in this area are constantly evolving, and we intend to monitor these laws and take commercially reasonable steps to protect ourselves from the impact of these laws, including where deemed necessary, obtaining environmental assessments of properties that we acquire; however, we will not obtain an independent third-party environmental assessment for every property we acquire. In addition, any such assessment that we do obtain may not reveal all environmental liabilities or whether a prior owner of a property created a material environmental condition not known to us. The cost of defending against claims of liability, of compliance with environmental regulatory requirements, of remediating any contaminated property, or of paying personal injury claims would materially adversely affect our business, assets or results of operations and, consequently, amounts available for distribution.
Our focus on the energy infrastructure sector will subject us to more risks than if we were broadly diversified.
Because we specifically focus on the energy infrastructure sector, investments in our common stock may present more risks than if we were broadly diversified over numerous sectors of the economy. Therefore, a downturn in the U.S. energy infrastructure sector would have a larger impact on us than on a company that does not concentrate in one sector of the economy. The energy infrastructure sector can be significantly affected by the supply of and demand for specific products and services; the supply and demand for crude oil, natural gas, and other energy commodities; the price of crude oil, natural gas, and other energy commodities; exploration, production and other capital expenditures; government regulation; world and regional events and economic conditions.
Energy infrastructure companies are subject to variations in the supply and demand of various energy commodities.
A decrease in the production of natural gas, natural gas liquids, crude oil, coal, refined petroleum products or other such commodities, or a decrease in the volume of such commodities available for transportation, mining, processing, storage or distribution, may adversely impact the financial performance of companies in the energy infrastructure sector. Production declines and volume decreases could be caused by various factors, including catastrophic events affecting production, depletion of resources, labor difficulties, political events, OPEC actions, environmental proceedings, increased regulations, equipment failures and unexpected maintenance problems, failure to obtain necessary permits, unscheduled outages, unanticipated expenses, inability to successfully carry out new construction or acquisitions, import supply disruption, increased competition from alternative energy sources or related commodity prices. Alternatively, a sustained decline in demand for such commodities could also adversely affect the financial performance of companies in the energy infrastructure sector. Factors that could lead to a decline in demand include economic recession or other adverse economic conditions, higher fuel taxes or governmental regulations, increases in fuel economy, consumer shifts to the use of alternative fuel sources, changes in commodity prices or weather. Factors that could lead to a decrease in market demand include a recession or other adverse economic conditions, an increase in the market price of the underlying commodity, higher taxes or other regulatory actions that increase costs, or a shift in consumer demand for such products. Demand may also be adversely impacted by consumer sentiment with respect to global warming and/or by any state or federal legislation intended to promote the use of alternative energy sources such as bio-fuels, solar and wind. Should energy infrastructure companies experience variations in supply and demand as described above, the resulting decline in operating or financial performance could impact the value or quality of our assets.
Many companies in the energy infrastructure sector are subject to the risk that they, or their customers, will be unable to replace depleted reserves of energy commodities.
Many companies in the energy infrastructure sector are either (i) engaged in the production of natural gas liquids, refined petroleum products, or aggregates such as crushed stone, sand and gravel, or (ii) are engaged in transporting, storing, distributing and processing these items on behalf of producers. To maintain or grow their revenues, many customers of these companies need to maintain or expand their reserves through exploration of new sources of supply, through the development of existing sources, through acquisitions, or through long-term contracts to acquire reserves. The financial performance of companies in the energy infrastructure sector, which we expect to comprise all of the tenants for the properties in which we plan to invest, may be adversely affected if the companies to which they provide service are unable to cost-effectively acquire additional reserves sufficient to replace the natural decline. These adverse impacts on our tenants also could adversely impact the value or quality of our assets.
Energy infrastructure companies are and will be subject to extensive regulation because of their participation in the energy infrastructure sector, which could adversely impact the business and financial performance of our tenants and the value of our assets.
Companies in the energy infrastructure sector are subject to significant federal, state and local government regulation in virtually every aspect of their operations, including how facilities are constructed, maintained and operated, environmental and safety controls, and the prices they may charge for the products and services they provide. Various governmental authorities have the power to enforce compliance with these regulations and the permits issued under them, and violators are subject to administrative, civil and criminal penalties, including civil fines, injunctions or both. Stricter laws, regulations or enforcement policies could be enacted in the future that likely would increase compliance costs, which could adversely affect the business and financial performance of our tenants in the energy infrastructure sector and the value or quality of our assets.
Energy infrastructure companies are and will be subject to the risk of fluctuations in commodity prices.
The operations and financial performance of companies in the energy infrastructure sector may be directly affected by energy commodity prices, especially those companies in the energy infrastructure sector owning the underlying energy commodity. Commodity prices fluctuate for several reasons, including changes in market and economic conditions, the impact of weather on demand or supply, levels of domestic production and imported commodities, energy conservation, domestic and foreign governmental regulation and taxation and the availability of local, intrastate and interstate transportation systems. Volatility of commodity prices, which may lead to a reduction in production or supply, may also negatively impact the performance of companies in the energy infrastructure sector that are solely involved in the transportation, processing, storing, distribution or marketing of commodities. Volatility of commodity prices may also make it more difficult for companies in the energy infrastructure sector to raise capital to the extent the market perceives that their performance may be tied directly or indirectly to commodity prices. Historically, energy commodity prices have been cyclical and exhibited significant volatility. Should energy infrastructure companies experience variations in supply and demand as described above, the resulting decline in operating or financial performance could impact the value or quality of our assets.
Energy infrastructure companies are and will be subject to the risk of extreme weather patterns.
Extreme weather patterns, such as prolonged or abnormal seasons, or specific events, such as hurricanes, could result in significant volatility in the supply of energy and power. This volatility may create fluctuations in commodity prices and earnings of companies in the energy infrastructure sector. Moreover, any extreme weather events, such as hurricanes, could adversely impact the assets and valuation of our real property assets or investment securities.
Additional Risks to Common Stockholders
Our use of leverage increases the risk of investing in our securities and will increase the costs borne by common stockholders.
Our use of leverage through the issuance of any preferred stock or debt securities, and any additional borrowings or other transactions involving indebtedness (other than for temporary or emergency purposes) are or would be considered “senior securities” and create risks. Leverage may adversely affect common stockholders. If the return on securities acquired with borrowed funds or other leverage proceeds does not exceed the cost of the leverage, the use of leverage could cause us to lose money.
Our issuance of senior securities involves offering expenses and other costs, including interest payments, which are borne indirectly by our common stockholders. Fluctuations in interest rates could increase interest or dividend payments on our senior securities, and could reduce cash available for distribution on common stock. Increased operating costs, including the financing cost associated with any leverage, may reduce our total return to common stockholders.
Rating agency guidelines applicable to any senior securities may impose asset coverage requirements, dividend limitations, voting right requirements (in the case of the senior equity securities), and restrictions on our portfolio composition and our use of certain investment techniques and strategies. The terms of any senior securities or other borrowings may impose additional requirements,
restrictions and limitations that are more stringent than those required by a rating agency that rates outstanding senior securities. These requirements may have an adverse effect on us and may affect our ability to pay distributions on common stock and preferred stock. To the extent necessary, we may redeem our senior securities to maintain the required asset coverage. Doing so may require that we liquidate investments at a time when it would not otherwise be desirable to do so.
In addition, lenders from whom we may borrow money or holders of our debt securities may have fixed dollar claims on our assets that are superior to the claims of our stockholders, and we have granted, and may in the future grant, a security interest in our assets in connection with our debt. In the case of a liquidation event, those lenders or note holders would receive proceeds before our stockholders. If the value of our assets increases, then leveraging would cause the book value of our common stock to increase more than it otherwise would have had we not leveraged. Conversely, if the value of our assets decreases, leveraging would cause the book value of our common stock to decline more than it otherwise would have had we not leveraged. Similarly, any increase in our revenue in excess of interest expense on our borrowed funds would cause our net income to increase more than it would without the leverage. Any decrease in our revenue would cause our net income to decline more than it would have had we not borrowed funds and could negatively affect our ability to make distributions on our common stock. Our ability to service any debt that we incur will depend largely on our financial performance and the performance of our portfolio companies and will be subject to prevailing economic conditions and competitive pressures.
Sales of our common stock may put pressure on our stock price.
The sale of our common stock (or the perception that such sales may occur) may have an adverse effect on prices in the secondary market for our common stock. An increase in the number of shares of common stock available may put downward pressure on the market price for our common stock and make it more difficult for stockholders to sell their shares. These sales also might make it more difficult for us to sell additional equity securities in the future at a time and price we deem appropriate.
Additional Risks Related to Warrants and Subscription Rights
An active public market for our outstanding common stock warrants or any other subscription rights may not develop.
Currently, no public market exists for our outstanding warrants to purchase shares of our common stock, and we cannot assure you that one will develop or be sustained for such warrants, or for any other subscription rights we may issue. We have not listed such warrants, and may not list any future subscription rights on any national securities exchange or automated quotation system.
There may be dilution of the value of our common stock when our warrants or any other subscription rights are exercised, or if we issue common stock below book value.
The issuance of additional common stock upon the exercise of our outstanding warrants, or of any future subscription rights, if the warrants or subscription rights are exercised at a time when the exercise price is less than the book value per share of our common stock, will have a dilutive effect on the value of our common stock.
The outstanding warrants to purchase common stock, and any future subscription rights, may have no value in bankruptcy.
In the event a bankruptcy or reorganization is commenced by or against us, a bankruptcy court may hold that unexercised warrants or other subscription rights are executory contracts subject to rejection by us with approval of the bankruptcy court. As a result, holders of warrants or subscription rights may, even if sufficient funds are available, not be entitled to receive any consideration or may receive an amount less than they would be entitled to if they had exercised their warrants or subscription rights prior to the commencement of any such bankruptcy or reorganization.
As a holder of warrants or subscription rights, you will not receive distributions on our common stock.
Holders of warrants or other subscription rights to purchase our common stock will not have the right to receive any distributions and will not have any voting rights so long as their warrants or subscription rights are unexercised.
ITEM 1B. UNRESOLVED STAFF COMMENTS
None.
ITEM 2. PROPERTIES
Portland Terminal Facility
On January 21, 2014, subsequent to our fiscal year end our subsidiary, LCP Oregon, closed on a Purchase and Sale Agreement. LCP Oregon acquired the Portland Terminal Facility, with certain associated real property rights for $40 million in cash. LCP Oregon entered into a long-term triple net Lease Agreement on January 21, 2014, relating to the use of the Portland Terminal Facility (the “Portland Lease Agreement”) with Arc Terminals Holdings LLC ("Arc Terminals"), an indirect wholly-owned subsidiary of Arc Logistics.
The Portland Terminal Facility is a rail/marine facility property adjacent to the Willamette River in Portland, Oregon. The 42-acre site has 84 tanks with a total storage capacity of approximately 1,500,000 barrels. The Portland Terminal Facility is capable of receiving, storing and delivering crude oil and refined petroleum products. Products are received and/or delivered via railroad or marine (up to Panamax size vessels). The marine facilities are accessed through a neighboring terminal facility via an owned pipeline. The Portland Terminal Facility offers heating systems, emulsions and an on-site product testing laboratory as ancillary services.
We anticipate funding an additional $10 million of terminal-related improvement projects in support of Arc Terminals’ commercial strategy to optimize the Portland Terminal Facility and generate stable cash flows, including: i) upgrade a portion of the existing storage assets; ii) enhance existing terminal infrastructure; and iii) develop, design, engineer and construct throughput expansion opportunities.
Pinedale LGS
On December 20, 2012, Pinedale LP closed on a Purchase and Sale Agreement with a wholly-owned subsidiary of Ultra Petroleum Corp. ("Ultra Petroleum" or "Ultra"), relating to the acquisition of the Pinedale LGS assets.
Construction of the Pinedale LGS was completed in 2010 and consists of more than 150 miles of pipelines with 107 receipt points, and four central storage facilities located in the Pinedale Anticline in Wyoming that are utilized by Ultra Petroleum as a method for the gathering of a commingled hydrocarbon stream, then this stream is separated into its components of water, condensate and natural gas, for the purpose of subsequently storing, selling or disposing of these separated components. Prior to entering the Pinedale LGS, Ultra Petroleum will separate the produced stream into wellhead natural gas and the liquids stream. The wellhead natural gas is then transported to market by a third-party. The remaining liquid, primarily water, is transported by Ultra Petroleum through the Pinedale LGS to one of its four central storage facilities where it is separated into separate components. Condensate is a valuable hydrocarbon commodity that is sold by Ultra Petroleum; water is transported to disposal wells or a treatment facility for re-use; and natural gas is sold by Ultra Petroleum or otherwise used by Ultra Petroleum for fueling on-site operational equipment. Ultra Petroleum’s non-operating working interest partners in the Pinedale field where the LGS is located pay Ultra Petroleum a fee for the use of Ultra Petroleum’s LGS. To date, no major operational issues have been reported with respect to the Pinedale LGS.
The Pinedale LGS has a current capacity of approximately 45,000 barrels per day. The underground pipelines constituting the majority of the Pinedale LGS and certain other components, such as the separators, have useful lives that extend beyond the initial term of the Pinedale Lease Agreement. We believe that the Pinedale LGS is capable of being expanded at a relatively low incremental cost by, for example, adding additional separating equipment.
As of December 31, 2013, Ultra Petroleum had an estimated 3.61 Tcfe of proved reserves and in 2013, converted 130 Bcfe of proved undeveloped reserves to proved developed reserves.
Most of Ultra Petroleum’s exploration and development in the Pinedale field takes place on land under the jurisdiction of the Bureau of Land Management ("BLM"). The BLM has the authority to approve or deny oil and gas leases or to impose environmental restrictions on leases where appropriate. The BLM issued the Pinedale Record of Decision (“ROD”) in September 2008. Under the ROD, Ultra Petroleum gained year-round access to the Pinedale field for drilling and completion activities in development areas, provided Ultra Petroleum conducts an environmental mitigation effort, which includes the use of a liquids gathering system. This additional access resulted in increased drilling efficiencies and allowed for accelerated development of the field.
Eastern Interconnect Project
We own a 40 percent undivided interest in the EIP transmission assets, which move electricity across New Mexico between Albuquerque and Clovis. The physical assets include 216 miles of 345 kilovolts transmission lines, towers, easement rights, converters and other grid support components. These assets are leased on a triple net basis through April 1, 2015 to PNM, an independent electric utility company serving approximately 500 thousand customers in New Mexico. PNM is a subsidiary of PNM Resources Inc. (NYSE: PNM). On November 1, 2012, we entered into a purchase agreement with PNM to sell our interest in the EIP upon lease termination on April 1, 2015 for $7.7 million. PNM also accelerated its remaining lease payments to us. Both lease payments due in 2013 were paid upon execution of that purchase agreement on November 1, 2012. The three remaining lease payments which would have been due April 1, 2014, October 1, 2014 and April 1, 2015, were paid in full on January 2, 2014.
We changed our estimated residual value used to calculate depreciation of the EIP which will result in higher depreciation expenses beginning in November of 2012 through the expiration of the lease in April 2015. The incremental depreciation amounts to approximately $393,000 per quarter.
Wholly Owned Subsidiary—Mowood
We indirectly hold 100 percent of the equity interests in Mowood, through a taxable REIT subsidiary of the Company. Mowood is the holding company of Omega. Omega is a natural gas service provider located primarily on the Fort Leonard Wood military post in south-central Missouri. Omega has a contract with the Department of Defense to provide natural gas supply and distribution services to Fort Leonard Wood through Omega’s approximate 70 mile pipeline distribution system on the post. In addition, Omega provides natural gas marketing services to several customers in the surrounding area.
Principal Location
Our principal executive office is located at 1100 Walnut Street, Suite 3350, Kansas City, MO 64106.
ITEM 3. LEGAL PROCEEDINGS
We are not currently subject to any material legal proceedings, nor, to our knowledge, is any material legal proceeding threatened against us.
ITEM 4. MINE SAFETY DISCLOSURES
Not applicable.
PART II
ITEM 5. MARKET FOR REGISTRANT’S COMMON EQUITY, RELATED STOCKHOLDER MATTERS AND ISSUER PURCHASES OF EQUITY SECURITIES
Price Range of Common Stock
Since December 3, 2012, the Company’s common stock has been traded on the New York Stock Exchange (“NYSE”), under the symbol “CORR”. Previously the common stock was traded on the NYSE under the symbol “TTO”. The following table sets forth the range of high and low sales prices of our common shares and the distributions declared by us for each fiscal quarter for our two most recent fiscal years:
|
| | | | | | | | | | | | |
| | Price Range | | Cash Distribution |
| | High | | Low | | per Share(1) |
2012 | | | | | | |
First quarter | | $ | 9.44 |
| | $ | 7.24 |
| | $ | 0.1100 |
|
Second quarter | | $ | 9.33 |
| | $ | 7.93 |
| | $ | 0.1100 |
|
Third quarter | | $ | 9.44 |
| | $ | 8.41 |
| | $ | 0.1100 |
|
Fourth quarter | | $ | 9.28 |
| | $ | 8.26 |
| | $ | 0.1100 |
|
Transition Period | | | | | | |
December 31, 2012 | | $ | 8.78 |
| | $ | 5.85 |
| | — |
|
2013 | | | | | | |
First quarter | | $ | 7.06 |
| | $ | 6.03 |
| | $ | 0.1250 |
|
Second quarter | | $ | 7.90 |
| | $ | 6.84 |
| | $ | 0.1250 |
|
Third quarter | | $ | 7.77 |
| | $ | 6.95 |
| | $ | 0.1250 |
|
Fourth quarter | | $ | 7.12 |
| | $ | 6.56 |
| | — |
|
| |
(1) | Represents the distribution declared in the specified period. The 2013 fourth quarter dividend was paid in the first quarter of 2014. On January 3, 2014, our Board declared a dividend of $0.125 per share, payable January 23, 2014 to common stockholders of record as of January 13, 2014. |
The last reported price for our common stock as of December 31, 2013 was $7.12 per share. As of December 31, 2013, we had 26 stockholders of record.
Distributions
Our portfolio of real property assets, promissory notes, and investment securities generates cash flow to us from which we pay distributions to stockholders. At fiscal year-end 2013, the sources of our stockholder distributions were lease income from our
real property assets and distributions from our investment securities. The amount of any distribution is recorded by the Company on the ex-dividend date.
The character of distributions made during the year may differ from their ultimate characterization for federal income tax purposes. Although, there is no assurance that we will continue to make regular distributions, we continue to believe that our investments should support sustainable 2014 distributions on a quarterly basis, and an estimated total 2014 annualized distributions of not less than $0.52 per share.
Federal and State Income Taxation
As a REIT, we will not pay federal income tax on taxable income that is distributed to our stockholders. Our distributions from earnings and profits will be treated as ordinary income and generally will not qualify as qualified dividend income ("QDI").
We have made an election to be treated as a REIT throughout 2013 by filing a Form 1120-REIT on March 17, 2014. We will be taxed as a REIT rather than a C corporation and generally will not pay federal income tax on taxable income that is distributed to our stockholders. Our distributions from earnings and profits will be treated as ordinary income and generally will not qualify as QDI and will not be qualifying for purposes of the dividend received deduction ("DRD"). As a REIT, certain dividends related to long-term capital gains may be taxed as capital gains dividends. As a REIT, we will be subject to a corporate level tax on certain built-in gains on certain assets if such assets are sold during the following conversion. Built-in gain assets are assets whose fair market value exceeds the REIT’s adjusted tax basis at the time of conversion. In addition, a REIT may not have any earnings and profits accumulated in a non-REIT year. Thus, upon our conversion to a REIT, we were required to distribute to our stockholders all accumulated earnings and profits from prior non-REIT years. Such distributions were taxable to the stockholders as dividend income, and qualified as QDI for non-corporate stockholders and for the dividends received deduction for corporate stockholders in 2013.
We own taxable REIT subsidiaries ("TRSs"), which are treated as C corporations. As corporations, the TRSs are obligated to pay federal and state income tax on their taxable income. Our tax expense or benefit attributable to the TRSs is included in the Consolidated Statements of Income. Deferred income taxes reflect the net tax effects of temporary differences between the carrying amounts of assets and liabilities for financial reporting purposes and the amounts used for income tax purposes.
Recent Sales of Unregistered Securities
We did not sell any securities during the year ended December 31, 2013 that were not registered under the Securities Act of 1933.
Issuer Purchases of Equity Securities
We did not repurchase any of our common shares during the year ended December 31, 2013.
Performance Graph
As a result of the Company’s withdrawal of its election to be regulated as a BDC and the anticipated liquidation of the securities portfolio, the performance comparable group has also been revised to reflect a more appropriate set of benchmarks. As the Company has elected to be treated as a REIT, and has changed its primary focus to the acquisition of real property energy infrastructure assets that are leased back to operating companies such as utilities or other energy operators, it was determined that the FTSE NAREIT All Equity REIT Index (“FTSE NAREIT”), the Dow Jones Utilities Average Index (“DJ UTIL”), and the S&P Global Infrastructure Index (“SPGTIND”), are a more relevant set of indices. The graph assumes that, on December 31, 2008, a $100 investment was made in each of our common stock, the FTSE NAREIT, the DJ UTIL, the SPGTIND, and assumes the reinvestment of all cash dividends. The comparisons in the graph below are based on historical data and are not intended to forecast future performance of our common stock.
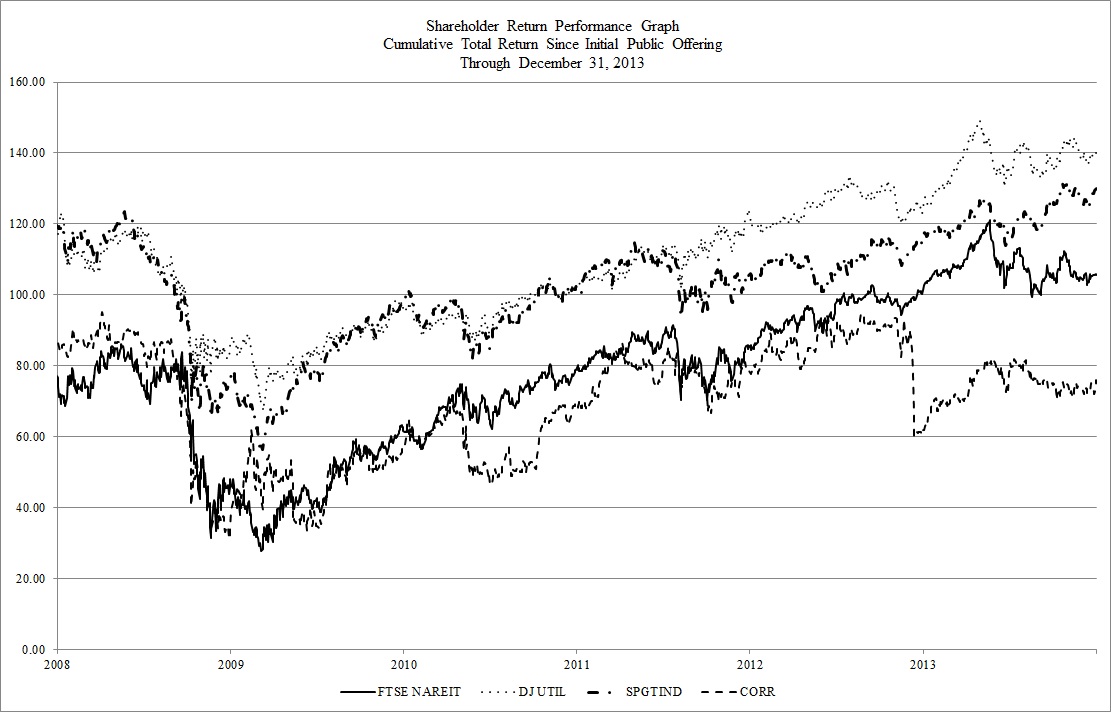
Our shares began trading on the NYSE on February 2, 2007.
ITEM 6. SELECTED FINANCIAL DATA
The selected financial data set forth below should be read in conjunction with “Management’s Discussion and Analysis of Financial Condition and Results of Operations,” and the financial statements and related notes included in this Annual Report on Form 10-K. The Company’s consolidated financial statements include the accounts of the Company and its wholly-owned subsidiary, Mowood. See Note 2.B. in the Notes to Consolidated Financial Statements for further disclosure. Financial information presented below for the years ended December 31, 2013, November 30, 2012, November 30, 2011, November 30, 2010, November 30, 2009 and the one-month transition period ended December 31, 2012 has been derived from our financial statements audited by Ernst & Young LLP, our independent registered public accounting firm. The historical data is not necessarily indicative of results to be expected for any future period.
Results of operations for the years ended December 31, 2013, November 30, 2012 and 2011, and the one-month transition period ended December 31, 2012, and the financial position at December 31, 2013 and 2012, and November 30, 2012 and 2011 reflect the consolidation of the Company’s wholly-owned subsidiary, Mowood, effective, September 21, 2011.
|
| | | | | | | | | | | | | | | | | | | | | | | | |
| | Year Ended December 31, 2013 | | Year Ended November 30, 2012 | | Year Ended November 30, 2011 | | Year Ended November 30, 2010 | | Year Ended November 30, 2009 | | One-Month Transition Period Ended December 31, 2012 |
Income statement data: | | | | | | | | | | | | |
Lease revenue | | $ | 22,552,976 |
| | $ | 2,552,975 |
| | $ | 1,063,740 |
| | $ | — |
| | $ | — |
| | $ | 857,909 |
|
Sales revenue | | 8,733,044 |
| | 8,021,022 |
| | 2,161,723 |
| | — |
| | — |
| | 868,992 |
|
Total revenue (1) | | 31,286,020 |
| | 10,573,997 |
| | 3,225,463 |
| | — |
| | — |
| | 1,726,901 |
|
Cost of sales | | 6,734,665 |
| | 6,078,102 |
| | 1,689,374 |
| | — |
| | — |
| | 686,976 |
|
Depreciation (2) | | 11,429,980 |
| | 1,118,269 |
| | 364,254 |
| | — |
| | — |
| | 499,357 |
|
Management fees, net of expense reimbursements (3) | | 2,637,265 |
| | 1,046,796 |
| | 968,163 |
| | 925,820 |
| | 1,126,327 |
| | 155,242 |
|
All other expenses (4) | | 4,228,475 |
| | 2,574,534 |
| | 1,637,585 |
| | 926,937 |
| | 911,779 |
| | 484,847 |
|
Total expenses | | 25,030,385 |
| | 10,817,701 |
| | 4,659,376 |
| | 1,852,757 |
| | 2,038,106 |
| | 1,826,422 |
|
Income (loss) from operations, before income taxes | | 6,255,635 |
| | (243,704 | ) | | (1,433,913 | ) | | (1,852,757 | ) | | (2,038,106 | ) | | (99,521 | ) |
Realized and unrealized gain (loss) on securities transactions, before income taxes(5) | | 5,366,553 |
| | 20,181,877 |
| | 4,583,748 |
| | 19,446,071 |
| | 1,126,632 |
| | (1,928,553 | ) |
Net distributions and dividend income from investments | | 584,814 |
| | (279,395 | ) | | 651,673 |
| | 1,853,247 |
| | 1,743,017 |
| | 2,325 |
|
Other income | | — |
| | — |
| | 40,000 |
| | 38,580 |
| | 61,514 |
| | — |
|
Interest expense | | (3,288,378 | ) | | (81,123 | ) | | (36,508 | ) | | (45,619 | ) | | (627,707 | ) | | (416,137 | ) |
Total other income (loss) and expense, net, before income taxes | | 2,662,989 |
| | 19,821,359 |
| | 5,238,913 |
| | 21,292,279 |
| | 2,303,456 |
| | (2,342,365 | ) |
Income (loss) before income taxes | | 8,918,624 |
| | 19,577,655 |
| | 3,805,000 |
| | 19,439,522 |
| | 265,350 |
| | (2,441,886 | ) |
Current and deferred tax (expense) benefit, net | | (2,949,518 | ) | | (7,228,934 | ) | | (882,857 | ) | | (4,772,648 | ) | | (254,356 | ) | | 920,143 |
|
Net income (loss) | | $ | 5,969,106 |
| | $ | 12,348,721 |
| | $ | 2,922,143 |
| | $ | 14,666,874 |
| | $ | 10,994 |
| | $ | (1,521,743 | ) |
Net income (loss) attributable to non-controlling interest | | 1,466,767 |
| | — |
| | — |
| | — |
| | — |
| | (18,347 | ) |
Net income (loss) attributable to CORR stockholders | | $ | 4,502,339 |
| | $ | 12,348,721 |
| | $ | 2,922,143 |
| | $ | 14,666,874 |
| | $ | 10,994 |
| | $ | (1,503,396 | ) |
Per common share data: | | | | | | | | | | | | |
Distributions to common stockholders (6) | | $ | 0.38 |
| | $ | 0.44 |
| | $ | 0.41 |
| | $ | 0.43 |
| | $ | 0.62 |
| | $ | — |
|
Earnings (loss) per common share: | | | | | | | | | | | | |
Basic and diluted | | $ | 0.19 |
| | $ | 1.34 |
| | 0.32 |
| | $ | 1.61 |
| | $ | — |
| | $ | (0.10 | ) |
|
| | | | | | | | | | | | | | | | | | | | | | | | |
| | December 31, 2013 | | November 30, 2012 | | November 30, 2011 | | November 30, 2010 | | November 30, 2009 | | December 31, 2012 |
Balance sheet data: | | | | | | | | | | | | |
Leased property, net | | $ | 232,220,618 |
| | $ | 12,995,169 |
| | $ | 13,832,540 |
| | $ | — |
| | $ | — |
| | $ | 243,078,709 |
|
Securities investments | | 23,304,321 |
| | 75,086,032 |
| | 68,894,372 |
| | 93,736,230 |
| | 82,483,094 |
| | 24,025,524 |
|
Property and equipment, net | | 3,318,483 |
| | 3,589,022 |
| | 3,842,675 |
| | — |
| | — |
| | 3,566,030 |
|
Other assets | | 25,032,237 |
| | 19,761,610 |
| | 7,717,809 |
| | 2,305,163 |
| | 6,994,959 |
| | 22,991,722 |
|
Total assets | | $ | 283,875,659 |
| | $ | 111,431,833 |
| | $ | 94,287,396 |
| | $ | 96,041,393 |
| | $ | 89,478,053 |
| | $ | 293,661,985 |
|
Long-term debt | | 70,000,000 |
| | — |
| | 2,279,883 |
| | — |
| | — |
| | 70,000,000 |
|
Other liabilities | | 8,334,289 |
| | 12,576,048 |
| | 1,581,200 |
| | 562,220 |
| | 5,181,468 |
| | 12,819,793 |
|
Total liabilities | | 78,334,289 |
| | 12,576,048 |
| | 3,861,083 |
| | 562,220 |
| | 5,181,468 |
| | 82,819,793 |
|
Total stockholders’ equity | | $ | 205,541,370 |
| | $ | 98,855,785 |
| | $ | 90,426,313 |
| | $ | 95,479,173 |
| | $ | 84,296,585 |
| | $ | 210,842,192 |
|
Total liabilities and stockholders’ equity | | $ | 283,875,659 |
| | $ | 111,431,833 |
| | $ | 94,287,396 |
| | $ | 96,041,393 |
| | $ | 89,478,053 |
| | $ | 293,661,985 |
|
| |
(1) | Revenues for the years and one-month transition period, respectively, ended: |
|
| | | | | | | | | | | | | | | | | | | | | | | | |
| | December 31, 2013 | | November 30, 2012 | | November 30, 2011 | | November 30, 2010 | | November 30, 2009 | | December 31, 2012 |
Lease Revenue: | | | | | | | | | | | |
|
|
UPL | | $ | 20,000,000 |
| | $ | — |
| | $ | — |
| | $ | — |
| | $ | — |
| | $ | 645,161 |
|
PNM | | 2,552,976 |
| | 2,552,975 |
| | 1,063,470 |
| | | | | | 212,748 |
|
Sales Revenue: | | | | | | | | | | | | |
Mowood | | 8,733,044 |
| | 8,021,022 |
| | 2,161,723 |
| | — |
| | — |
| | 868,992 |
|
Total Revenue | | $ | 31,286,020 |
| | $ | 10,573,997 |
| | $ | 3,225,193 |
| | $ | — |
| | $ | — |
| | $ | 1,726,901 |
|
Lease revenues include annual lease income for the UPL and EIP leased assets of $20 million and $2,552,976, respectively. UPL lease revenue was prorated for the one-month transition period ended December 2012, for the period subsequent to the December 20, 2012 acquisition. The EIP was acquired on June 30, 2011 with the lease to PNM commencing in July 2011, resulting in five months of PNM revenue being recognized for the year ended November 30, 2011. EIP lease revenue is reported net of the amortization of the intangible lease asset. Sales revenues for the years ended December 31, 2013, November 30, 2012, November 30, 2011 and the one-month transition period ended December 31, 2012, include the consolidation of the Company’s wholly-owned subsidiary, Mowood, effective, September 21, 2011, commensurate with the Company's decision to cease operating as a BDC. Previously, Mowood was reported at fair value with unrealized gains and losses being reported in other income.
| |
(2) | Depreciation expense for the years and one-month transition period, respectively, ended: |
|
| | | | | | | | | | | | | | | | | | | | | | | | |
| | December 31, 2013 | | November 30, 2012 | | November 30, 2011 | | November 30, 2010 | | November 30, 2009 | | December 31, 2012 |
Pinedale LGS | | $ | 8,868,283 |
| | $ | — |
| | $ | — |
| | $ | — |
| | $ | — |
| | $ | 286,054 |
|
EIP | | 2,278,681 |
| | 837,371 |
| | 294,309 |
| | — |
| | — |
| | 189,890 |
|
Mowood | | 283,016 |
| | 280,898 |
| | 69,945 |
| | — |
| | — |
| | 23,413 |
|
Depreciation Expense | | $ | 11,429,980 |
| | $ | 1,118,269 |
| | $ | 364,254 |
| | $ | — |
| | $ | — |
| | $ | 499,357 |
|
| |
(3) | Management fee analysis for the years and one-month transition period, respectively, ended: |
|
| | | | | | | | | | | | | | | | | | | | | | | | |
| | December 31, 2013 | | November 30, 2012 | | November 30, 2011 | | November 30, 2010 | | November 30, 2009 | | December 31, 2012 |
Gross Management Fees | | $ | 2,637,265 |
| | $ | 1,046,796 |
| | $ | 1,452,255 |
| | $ | 1,233,823 |
| | $ | 1,351,593 |
| | $ | 155,242 |
|
Expense Reimbursements | | | | | | (484,092 | ) | | (308,003 | ) | | (225,266 | ) | | — |
|
Net Management Fees | | $ | 2,637,265 |
| | $ | 1,046,796 |
| | $ | 968,163 |
| | $ | 925,820 |
| | $ | 1,126,327 |
| | $ | 155,242 |
|
Pursuant to the previous Investment Advisory Agreement with TCA, which was terminated as of November 30, 2011, the capital gain incentive fee was paid annually only if there were realization events and only if the calculation defined in the agreement resulted in an amount due. No capital gain incentive fees were due or payable since the initial commencement of operations.
| |
(4) | Other expense analysis for the years and one-month transition period, respectively, ended: |
|
| | | | | | | | | | | | | | | | | | | | | | | | |
| | December 31, 2013 | | November 30, 2012 | | November 30, 2011 | | November 30, 2010 | | November 30, 2009 | | December 31, 2012 |
Operating expenses | | $ | 3,422,392 |
| | $ | 2,196,700 |
| | $ | 999,400 |
| | $ | 926,937 |
| | $ | 911,779 |
| | $ | 420,114 |
|
Asset acquisition expenses | | 806,083 |
| | 377,834 |
| | 638,185 |
| | — |
| | — |
| | 64,733 |
|
Total Other Expenses | | $ | 4,228,475 |
| | $ | 2,574,534 |
| | $ | 1,637,585 |
| | $ | 926,937 |
| | $ | 911,779 |
| | $ | 484,847 |
|
Operating expense for the years ended December 31, 2013, November 30, 2012, November 30, 2011 and the one-month transition period ended December 31, 2012, includes the consolidation of the Company’s wholly-owned subsidiary, Mowood, effective, September 21, 2011. In addition, the variance in operating expenses is due to the combination of increased legal and external audit and tax fees associated with the various interactions with the SEC, EIP and PNM related to pending sale transaction, REIT planning, and the new XBRL filing requirements. Asset acquisition expenses incurred during the year ended December 31, 2013 correspond to the pursuit of potential acquisitions. Generally, we expect asset acquisition expenses to be repaid over time from income generated by acquisitions. However, any particular quarter may reflect significant expenses arising from third party legal, engineering and consulting fees that are incurred in the early to mid stages of due diligence. Asset acquisition expenses for the years ended November 30, 2012 and 2011 reflect the pursuit of the Pinedale LGS and EIP acquisitions, respectively.
(5) For the year ended November 30, 2009, the Company had unrealized appreciation of $24,247,380 (before deferred taxes) and realized losses of $23,120,748 (before deferred taxes). The unrealized appreciation was driven by increased fair values of portfolio holdings resulting from a significant rebound in the MLP sector from the downturn in late 2008. During the credit crisis of 2008 and 2009, access to credit through the bank market became more restrictive and expensive. During that time, the Company was not able to renew its credit facility and liquidated a portion of its portfolio holdings in order to pay off the credit facility, resulting in the recognition of realized losses.
For the year ended November 30, 2010, the Company had unrealized appreciation of $30,564,590 (before deferred taxes) and realized losses of $11,118,519 (before deferred taxes). The unrealized appreciation was driven by primarily by an increase in the fair value of its private holdings, most notably International Resource Partners which increased approximately $18 million during the year. Quest Midstream Partners completed its transformation into a publicly traded C-corp, PostRock Energy Corp. (NASDAQ: PSTR) in March 2010. PSTR was a new corporation formed for the purpose of wholly owning all three Quest entities. Upon closing of the merger, the Company received nearly half a million freely tradable common units of PSTR in exchange for its common units of Quest Midstream. Subsequently, the stock price declined significantly and the Company sold its units in an orderly liquidation, resulting in the recognition of realized losses.
For the year ended November 30, 2011, the Company had unrealized depreciation of $22,268,455 (before deferred taxes) and realized gains of $26,852,203 (before deferred taxes). The unrealized depreciation and realized gains were driven by primarily by International Resource Partners.
For the year ended November 30, 2012, the Company had unrealized appreciation of $4,352,628 (before deferred taxes) and realized gains of $15,829,249 (before deferred taxes). The realized gain was driven primarily by the sale of High Sierra during the second quarter.
For the one-month transition period ended December 31, 2012, the Company had unrealized depreciation of $6,591,763 (before deferred taxes) and realized gains of $4,663,210 (before deferred taxes). The realized gain was driven primarily by the sale of all public securities during the one-month period ended December 31, 2012
For the year ended December 31, 2013, the Company had unrealized appreciation of $4,875,071 (before deferred taxes) and realized gains of $491,482 (before deferred taxes). The realized gain was driven primarily by the sale of NGL during the first quarter.
(6) The character of distributions made during the year may differ from the ultimate characterization for federal income tax purposes. For the year ended December 31, 2013, the Company's distributions, for book purposes, were comprised of 100 percent return of capital, and for tax purposes were comprised of 43 percent Qualified Dividend Income and 57 percent return of capital. For the year ended November 30, 2012, the Company’s distributions, for book and tax purposes, were comprised of 100 percent return of capital. For the year ended November 30, 2011, the Company’s distributions for tax purposes were comprised of 100 percent investment income and the source of the distributions for book purposes was 100 percent return of capital. For the year ended November 30, 2010, the Company’s distributions, for book and tax purposes, were comprised of 100 percent return of capital. For the year ended November 30, 2009, the Company’s distributions, for book and tax purposes, were comprised of 100 percent return of capital. The differences in characterization of the distributions from year to year is as a result of our change to a REIT and the fact that our distributions exceed our taxable income.
ITEM 7. MANAGEMENT’S DISCUSSION AND ANALYSIS OF FINANCIAL CONDITION AND RESULTS OF OPERATIONS
Certain statements included or incorporated by reference in this Annual Report on Form 10-K may be deemed “forward looking statements” within the meaning of the federal securities laws. In many cases, these forward looking statements may be identified by the use of words such as “will,” “may,” “should,” “could,” “believes,” “expects,” “anticipates,” “estimates,” “intends,” “projects,” “goals,” “objectives,” “targets,” “predicts,” “plans,” “seeks,” or similar expressions. Any forward-looking statement speaks only as of the date on which it is made and is qualified in its entirety by reference to the factors discussed throughout this report.
Although we believe the expectations reflected in any forward-looking statements are based on reasonable assumptions, forward-looking statements are not guarantees of future performance or results and we can give no assurance that these expectations will be attained. Our actual results may differ materially from those indicated by these forward-looking statements due to a variety of known and unknown risks and uncertainties. In addition to the risk factors discussed in Part I, Item 1A of this report, such known risks and uncertainties include, without limitation:
| |
• | the ability of our tenants to make payments under their respective leases, our reliance on certain major tenants and our ability to re-lease properties that become vacant; |
| |
• | our ability to obtain suitable tenants for our properties; |
| |
• | changes in economic and business conditions, including the financial condition of our tenants and general economic conditions in the energy industry, and in the particular sectors of that industry served by each of our infrastructure assets; |
| |
• | the inherent risks associated with owning real estate, including local real estate market conditions, governing laws and regulations, including potential liabilities relating to environmental matters, and illiquidity of real estate investments; |
| |
• | our ability to sell properties at an attractive price; |
| |
• | our ability to repay debt financing obligations; |
| |
• | our ability to refinance amounts outstanding under our credit facilities at maturity on terms favorable to us; |
| |
• | the loss of any member of our management team; |
| |
• | our ability to comply with certain debt covenants; |
| |
• | our ability to integrate acquired properties and operations into existing operations; |
| |
• | our continued ability to access the debt or equity markets; |
| |
• | the availability of other debt and equity financing alternatives; |
| |
• | market conditions affecting our debt and equity securities; |
| |
• | changes in interest rates under our current credit facility and under any additional variable rate debt arrangements that we may enter into in the future; |
| |
• | our ability to successfully implement our selective acquisition strategy; |
| |
• | our ability to maintain internal controls and processes to ensure all transactions are accounted for properly, all relevant disclosures and filings are timely made in accordance with all rules and regulations, and any potential fraud or embezzlement is thwarted or detected; |
| |
• | changes in federal or state tax rules or regulations that could have adverse tax consequences; |
| |
• | declines in the market value of our investment securities; and |
| |
• | changes in federal income tax regulations (and applicable interpretations thereof), or in the composition or performance of our assets, that could impact our ability to continue to qualify as a real estate investment trust for federal income tax purposes. |
This list of risks and uncertainties is only a summary and is not intended to be exhaustive. We disclaim any obligation to update or revise any forward-looking statements to reflect actual results or changes in the factors affecting the forward-looking information.
BUSINESS OBJECTIVE
Our business objective is to provide shareholders with an attractive risk-adjusted return, with an emphasis on distributions and long-term distribution growth of 1-3 percent. We expect our portfolio of midstream and downstream U.S. energy infrastructure real property assets to provide 8-10 percent total return over the long-term.
Our assets are generally leased to energy companies via long-term triple net participating leases. The lease structure requires that the tenant pay all operating expenses of the business conducted by the tenant, including real estate taxes, insurance, utilities, and expenses of maintaining the asset in good working order.
Our long-term participating lease structures provide us base rents that are fixed and determinable, with escalators dependent upon increases in the Consumer Price Index. Leases may also include features that allow us to participate in the financial performance and/or value of the energy infrastructure asset.
The assets we own and seek to acquire include pipelines, storage tanks, transmission lines and gathering systems, among others. We intend to acquire assets that will enhance the stability of our dividend through diversification, while offering the potential for long term distribution growth.
Basis of Presentation
The consolidated financial statements include CorEnergy Infrastructure Trust, Inc., as of December 31, 2013, and its direct and indirect wholly-owned subsidiaries. All significant intercompany accounts and transactions have been eliminated in consolidation.
Critical Accounting Policies
The financial statements included in this report are based on the selection and application of critical accounting policies, which require management to make significant estimates and assumptions. Critical accounting policies are those that are both important to the presentation of our financial condition and results of operations and require management’s most difficult, complex or subjective judgments. The preparation of the consolidated financial statements in conformity with U.S. generally accepted accounting principles (“GAAP”) requires management to make estimates and assumptions that affect the reported amount of assets and liabilities, recognition of distribution income and disclosure of contingent assets and liabilities at the date of the consolidated financial statements. Actual results could differ from those estimates. Note 2 to the Consolidated Financial Statements, included in this report, further details information related to our significant accounting policies.
Long-Lived Assets and Intangibles
Property and equipment are stated at cost less accumulated depreciation. Across all long-lived assets and intangibles depreciation is computed using the straight-line method over the estimated useful life of each asset. Expenditures for repairs and maintenance are charged to operations as incurred, and improvements, which extend the useful lives of assets, are capitalized and depreciated over the remaining estimated useful life of the asset.
We initially record long-lived assets at their acquisition cost, unless the transaction is accounted for as a business combination. If the transaction is accounted for as a business combination, we allocate the purchase price to the acquired tangible and intangible assets and liabilities based on their estimated fair values. We determine the fair values of assets and liabilities based on discounted cash flow models using current market assumptions, appraisals, recent transactions involving similar assets or liabilities and/or other objective evidence, and depreciates the asset values over the estimated remaining useful lives.
We may acquire long-lived assets that are subject to an existing lease contract with the seller or other lessee party and we may assume outstanding debt of the seller as part of the consideration paid. If, at the time of acquisition, the existing lease or debt contract is not at current market terms, we will record an asset or liability at the time of acquisition representing the amount by which the fair value of the lease or debt contract differs from its contractual value. Such amount is then amortized over the remaining contract term as an adjustment to the related lease revenue or interest expense.
We periodically review our long-lived assets, primarily real estate, for impairment whenever events or changes in circumstances indicate that the carrying amount of such assets may not be recoverable. Our review involves comparing current and future operating performance of the assets, the most significant of which is undiscounted operating cash flows, to the carrying value of the assets.
Investment Securities
Our investments in securities are classified as either trading or other equity securities:
| |
• | Trading securities – our publicly traded equity securities are classified as trading securities and are reported at fair value because we intend to sell these securities in order to acquire real asset investments. |
| |
• | Other equity securities represent interests in private companies for which we have elected to report these at fair value under the fair value option. |
Securities transactions are accounted for on the date the securities are purchased or sold (trade date). Realized gains and losses are reported on an identified cost basis.
Our other equity securities are primarily in illiquid securities of privately-held companies that are generally subject to restrictions on resale, have no established trading market and are fair valued on a quarterly basis. Because of the inherent uncertainty of
valuation, the fair values of such securities, which are determined in accordance with procedures approved by our Board of Directors, may differ materially from the values that would have been used had a ready market existed for the investments.
Realized and unrealized gains (losses) on trading securities and other equity securities – Changes in the fair values of the Company’s securities during the period reported and the gains or losses realized upon sale of securities during the period are reflected as other income within the accompanying Consolidated Statements of Income.
Revenue Recognition
Specific policies for our revenue and other income items are as follows:
| |
• | Sales Revenue – Mowood’s subsidiary, Omega, acting as a principal, provides for transportation services and natural gas supply for its customers on a firm basis. In addition, Omega is paid fees for the operation and maintenance of its natural gas distribution system, including any necessary expansion of the distribution system. Omega is responsible for the coordination, supervision and quality of the expansions while actual construction is generally performed by third party contractors. Revenues related to natural gas distribution are recognized upon delivery of natural gas and upon the substantial performance of management and supervision services related to the expansion of the natural gas distribution system. Revenues from expansion efforts are recognized in accordance with GAAP using either a completed contract or percentage of completion method based on the level and volume of estimates utilized, as well as the certainty or uncertainty of our ability to collect those revenues. |
| |
• | Lease Income – Income related to our leased property is recognized on a straight-line basis over the term of the lease when collectibility is reasonably assured. Rental payments on the leased property are typically received on a semi-annual basis and are included as lease income within the accompanying Consolidated Statements of Income. |
| |
• | Dividends and distributions from investments – Dividends and distributions from investments are recorded on their ex-dates and are reflected as other income within the accompanying Consolidated Statements of Income. Distributions received from our investments generally are characterized as ordinary income, capital gains and distributions received from investment securities. The portion characterized as return of capital is paid by our investees from their cash flow from operations. We record investment income, capital gains and distributions received from investment securities based on estimates made at the time such distributions are received. Such estimates are based on information available from each company and/or other industry sources. These estimates may subsequently be revised based on information received from the portfolio entities after their tax reporting periods are concluded, as the actual character of these distributions is not known until after our fiscal year end. |
| |
• | Securities Transactions and Investment Income Recognition – Securities transactions are accounted for on the date the securities are purchased or sold (trade date). Realized gains and losses are reported on an identified cost basis. Distributions received from our equity investments generally are comprised of ordinary income, capital gains and distributions received from investment securities from the portfolio company. The Company records investment income and return of capital based on estimates made at the time such distributions are received. Such estimates are based on information available from each portfolio company and/or other industry sources. These estimates may subsequently be revised based on information received |
Cost of Sales
Included in our cost of sales are the amounts paid for natural gas and propane, along with related transportation costs, as well as the cost of material and labor related to the expansion of the natural gas distribution system.
Federal and State Income Taxation
We made an election to be treated as a REIT for tax purposes for 2013 by filing a Form 1120-REIT on March 17, 2014. An investment in us will generally not result in Unrelated Business Taxable Income, except to the extent the tax-exempt investor leverages its investment.
Change in Fiscal Year End
On February 5, 2013, the Board of Directors of the Company approved a change in the Company's fiscal year end from November 30 to December 31. This change to the calendar year reporting cycle began January 1, 2013. As a result of the change, the Company reported a December 2012 fiscal month transition period, which was reported in the Quarterly Report on Form 10-Q for the calendar quarter ended March 31, 2013 and is included in this Annual Report on Form 10-K for the calendar year ending December 31, 2013.
RESULTS OF OPERATIONS
We have changed the format of the Results of Operations section to better portray the return generated by the different types of assets included in our portfolio. As leased assets become a more important component of the Company's business, we believe this new format will better portray the operating performance of the Company. We believe the Lease Revenue, Security Distributions and Operating Results overview presented below provides investors with information that will assist them in analyzing the operating performance of our leased assets, private equity securities and operating entities. As it pertains to Other Equity Securities, the Company does not believe that return of capital distributions and Realized/Unrealized gains and losses are indicative of the operating performance of these assets. Accordingly, we have excluded them from EBITDA, resulting in an Adjusted EBITDA metric. Adjusted EBITDA is then reconciled to the Net Income Attributable to CORR Stockholders by accounting for Other Income, Depreciation, Amortization, Interest Expense and Income Taxes. We believe that Net Income Attributable to CORR shareholders is an important operating metric which highlights the performance of our assets for shareholders to use in measuring our results.
Following is a comparison of lease revenues, security distributions and operating results, expenses, other income and expense, and income (loss) before income taxes for the years ended December 31, 2013, November 30, 2012 and November 30, 2011:
|
| | | | | | | | | | | | |
| | For the Years Ended |
| | December 31, 2013 | | November 30, 2012 | | November 30, 2011 |
Lease Revenue, Security Distributions, and Operating Results | | | | | | |
Leases: | | | | | | |
Lease revenue | | $ | 22,552,976 |
| | $ | 2,552,975 |
| | $ | 1,063,740 |
|
Other Equity Securities: | | | | | | |
Net cash distributions received | | 1,807,429 |
| | 4,705,975 |
| | 3,568,128 |
|
Operations: | | | | | | |
Sales revenue | | 8,733,044 |
| | 8,021,022 |
| | 2,161,723 |
|
Cost of sales | | (6,734,665 | ) | | (6,078,102 | ) | | (1,689,374 | ) |
Operating expenses (excluding depreciation and amortization) | | (924,571 | ) | | (739,519 | ) | | (196,775 | ) |
Net Operations (excluding depreciation and amortization) | | 1,073,808 |
| | 1,203,401 |
| | 275,574 |
|
| | | | | | |
Total Lease Revenue, Security Distributions, and Operating Results | | $ | 25,434,213 |
| | $ | 8,462,351 |
| | $ | 4,907,442 |
|
Expenses | | (5,879,864 | ) | | (2,881,811 | ) | | (2,408,973 | ) |
Non-Controlling Interest Attributable to Adjusted EBITDA Items | | (3,734,884 | ) | | — |
| | — |
|
Adjusted EBITDA Attributable to CORR Stockholders | | $ | 15,819,465 |
| | $ | 5,580,540 |
| | $ | 2,498,469 |
|
Other Income (Expense): | | | | | | |
Other Equity Securities: | | | | | | |
Net distributions and dividend income not recorded as income | | (1,222,615 | ) | | (4,985,370 | ) | | (2,916,455 | ) |
Net realized and unrealized gain on securities | | 5,366,553 |
| | 20,181,877 |
| | 4,583,748 |
|
Net Other Equity Securities | | 4,143,938 |
| | 15,196,507 |
| | 1,667,293 |
|
Other Income | | — |
| | — |
| | 40,000 |
|
Depreciation, Amortization, and Interest Expense: | | | | | | |
Depreciation & amortization | | (11,491,285 | ) | | (1,118,269 | ) | | (364,254 | ) |
Interest expense, net | | (3,288,378 | ) | | (81,123 | ) | | (36,508 | ) |
Non-controlling interest attributable to depreciation, amortization and interest expense | | 2,268,117 |
| | — |
| | — |
|
Net Depreciation, Amortization and Interest Expense | | (12,511,546 | ) | | (1,199,392 | ) | | (400,762 | ) |
Total Other Income (Expense): | | (8,367,608 | ) | | 13,997,115 |
| | 1,306,531 |
|
Income before Income Taxes Attributable to CORR stockholders | | 7,451,857 |
| | 19,577,655 |
| | 3,805,000 |
|
Income tax expense | | (2,949,518 | ) | | (7,228,934 | ) | | (882,857 | ) |
Income Attributable to CORR Stockholders | | $ | 4,502,339 |
| | $ | 12,348,721 |
| | $ | 2,922,143 |
|
| | | | | | |
Adjusted EBITDA per share (basic and diluted) | | $ | 0.66 |
| | $ | 0.61 |
| | $ | 0.27 |
|
Net earnings per share (basic and diluted) | | $ | 0.19 |
| | $ | 1.34 |
| | $ | 0.32 |
|
AFFO per share (basic and diluted)(1) | | $ | 0.52 |
| | $ | 0.43 |
| | N/A |
|
Book value per share (basic and diluted)(2) | | $ | 7.34 |
| | $ | 10.76 |
| | N/A |
|
(1)For a full reconciliation of AFFO per share (basic and diluted) to Income Attributable to CORR Stockholders, see FFO/AFFO Reconciliation table presented herein.
(2)For a full reconciliation of book value per share (basic and diluted) to Income Attributable to CORR Stockholders, see Book Value Per Share table presented herein.
Lease Revenue, Security Distributions and Operating Results
The Company's results of operations are reflective of our recent election to operate as a REIT. In 2013, our operating performance was derived primarily from leases of real property assets, distributions from our remaining portfolio of equity investments, and the operating results of Mowood. Total lease revenue, security distributions, and operating results generated by our investments for the year ended December 31, 2013 was approximately $25.4 million. This represents lease revenue from the Pinedale Liquids Gathering System (“Pinedale LGS”) and Public Service Company of New Mexico (“PNM”),the operating results of our wholly-owned subsidiary, Mowood, and cash distributions received from our portfolio of equity securities.
The increase in lease revenues over 2012 stems directly from the December 2012 acquisition of the Pinedale LGS. The $20 million annual minimum rent, as required under the Pinedale Lease Agreement, accounts for the $20 million increase for the year ended December 31, 2013, as compared to the year ended November 30, 2012. Due to annual CPI escalations in the Pinedale Lease Agreement, annual minimum rent for 2014 will increase by approximately 1.53 percent or $306 thousand. Lease revenues for the years ended November 30, 2012 and 2011 were approximately $2.6 million and $1.1 million, respectively. The revenue increase of approximately 140 percent for 2012 is attributable to the June 30, 2011 acquisition date of the EIP lease, and therefore only five months of lease activity was reported for the year ended November 30, 2011.
Cash distributions received from our portfolio of equity securities for the year ended December 31, 2013 were $1.8 million. The decrease of $2.9 million over the prior year is attributable to the sale of our portfolio of publicly traded securities, and to Lightfoot limiting their 2013 distributions to prepare for their IPO. The Company anticipates 2014 cash distributions from our portfolio of equity securities to be approximately $2.5 million. Cash distributions received from our portfolio securities for the years ended November 30, 2012 and 2011 were $4.7 million and $3.6 million, respectively.
Sales revenue, cost of sales, and operating expenses, excluding depreciation and amortization, related to Mowood's natural gas operations for the year ended December 31, 2013 were $8.7 million, $6.7 million and $925 thousand, respectively. The decrease in Net Operations, excluding depreciation and amortization of $130 thousand over the prior year is attributable to the increase in gas prices, decrease in system improvement and propane sales, the purchase of gas capacity, and nonrecurring personnel costs in 2013. Sales revenue, cost of sales, and operating expenses, excluding depreciation and amortization, related to Mowood's natural gas operations for the year ended November 30, 2012 were $8.0 million, $6.1 million and $740 thousand, respectively. Sales revenue, cost of sales, and operating expenses, excluding depreciation and amortization, related to Mowood's natural gas operations for the year ended November 30, 2011 were $2.2 million, $1.7 million and $197 thousand, respectively. Mowood was consolidated as of September 21, 2011 as a result of the Company's withdrawal of its election to be treated as a BDC. Had Mowood been consolidated as an operating entity during all of fiscal year 2011, sales revenue, cost of sales and operating expenses of approximately $9.4 million, $7.6 million and $711 thousand, respectfully, would have been reflected.
Expenses
Total expenses from operations for the year ended December 31, 2013 was $5.9 million. The most significant components of the variance from the prior year are outlined in the following table and explained below:
|
| | | | | | | | | | | |
Expenses |
| For the Years Ended |
| December 31, 2013 | | November 30, 2012 | | November 30, 2011 |
Management fees, net of expense reimbursements | $ | 2,637,265 |
| | $ | 1,046,796 |
| | $ | 968,163 |
|
Asset acquisition expense | 806,083 |
| | 377,834 |
| | 638,185 |
|
Professional fees/directors’ fees/other | 2,436,516 |
| | 1,457,181 |
| | 802,625 |
|
Total | $ | 5,879,864 |
| | $ | 2,881,811 |
| | $ | 2,408,973 |
|
Management fees for the year ended December 31, 2013 were $2.6 million. The increase, as compared to the year ended November 30, 2012, is due to the December 2012 acquisition of the Pinedale LGS. The increase from November 30, 2011 to 2012 is primarily due to the increase in the average value of the investment portfolio.
Asset acquisition expense represents costs incurred throughout the year as we pursue potential opportunities to expand our REIT-qualified asset portfolio. Annual costs for the year ended December 31, 2013 are $428 thousand higher than the year ended November 30, 2012. Costs incurred during the year ended December 31, 2013 correspond to the pursuit of potential acquisitions. Generally, we expect asset acquisition expenses to be repaid over time from income generated by acquisitions. However, any
particular quarter may reflect significant expenses arising from third party legal, engineering and consulting fees that are incurred in the early to mid stages of due diligence.
The remaining expenses, which include professional and directors' fees and other expenses, totaled $2.44 million for the year ended December 31, 2013. The increase of $979 thousand as compared to the year ended November 30, 2012 is driven by incremental costs related to the Pinedale LGS, additional costs associated with transitioning to a REIT, such as legal, financial audit and tax costs, the addition of two board members and other professional fees and services.
Non-Controlling Interest Attributable to Adjusted EBITDA Items
Based on Prudential's 18.95 percent ownership interest in Pinedale LP, the Company is required to make a further adjustment to the adjusted EBITDA items presented above to exclude the portion attributable to Prudential's non-controlling interest which totaled $3.73 million for the year ended December 31, 2013.
Adjusted EBITDA Attributable to CORR Stockholders
Adjusted EBITDA attributable to CORR Stockholders for the year ended December 31, 2013 was $15.8 million as compared to $5.6 million and $2.5 million for the years ended November 30, 2012 and 2011, respectively. As noted above, the increase in adjusted EBITDA is primarily related to the acquisition of the Pinedale LGS. The subsequent increase in lease revenue accounts for the majority of the fluctuation from the prior year.
Other Income and Expense
Total other income, net, for the year ended December 31, 2013 decreased $22.4 million, as compared to the year ended November 30, 2012. Other income and expense consists of four primary components: Return of Capital Distributions and Dividend Income; Realized and Unrealized Gains and Losses from Securities; Depreciation and Amortization; and Interest Expense. The two largest contributors to the decrease from prior year are the decrease in realized and unrealized gains and losses on securities and the increase in depreciation expense. As the Company has invested in REIT assets and exited investments in MLP equities, there has been a decrease in realized and unrealized gains and losses on securities within the period. The increase in depreciation expense is due primarily to the acquisition of the Pinedale LGS in December 2012. The following discussion expands on the impact of each of these four components on other income and expense.
Net Distributions and Dividend Income Not Recorded as Income
The following table summarizes the breakout of net distributions and dividends reported as income (loss) on the income statement. The table shows the gross distributions and dividend income received from our investment securities on a cash basis, less the amounts that were comprised of distributions and dividends not reported in income received from investment securities (return of capital):
|
| | | | | | | | | | | |
Gross Distributions and Dividend Income Received From Investment Securities |
| For the Years Ended |
| December 31, 2013 | | November 30, 2012 | | November 30, 2011 |
Distributions and dividend income received from investment securities | $ | 1,807,429 |
| | $ | 4,705,975 |
| | $ | 3,568,128 |
|
Less: distributions and dividends not reported in income (recorded as a cost reduction) | (1,222,615 | ) | | (4,985,370 | ) | | (2,916,455 | ) |
Net distributions and dividends reported as income (loss) | $ | 584,814 |
| | $ | (279,395 | ) | | $ | 651,673 |
|
Net Realized and Unrealized Gains and Losses on Securities
The decrease in realized and unrealized gains and losses from trading and other equity securities for the year ended December 31, 2013 totaled $14.8 million, as compared to the year ended November 30, 2012. In 2012, our income was still mostly derived from our portfolio of trading and other equity securities. By the beginning of 2013, we had liquidated nearly all of our trading securities and had acquired the Pinedale LGS, now our largest source of income. For the year ended December 31, 2013, the Company recognized an unrealized gain on the fair value adjustment of our other equity securities of $5.3 million and a realized gain of $316 thousand from the sale of publicly traded securities. Further, the characterization of distributions received from public and private investments is estimated based on prior year activity. After receiving final 2012 K-1s, which depict to the Company's share of income and losses from the investment in the security, it was determined that $567 thousand of previously recognized gain should be reclassified as dividend income. For the year ended December 31, 2013, $2.7 million of the $5.4 million gain is attributable to activity in the first quarter of 2013, which included the sale of the Company's remaining trading securities and the fair value adjustment of other equity securities which remain in our investment portfolio. Net realized and unrealized gains for
the fiscal years 2012 and 2011 were $20.2 million and $4.6 million, respectively. This represents an increase of approximately $14.6 million, which was primarily related to the sale of High Sierra during 2012.
Depreciation and Amortization
The acquisition of the Pinedale LGS and other acquisition efforts drove the increase in costs, with Pinedale depreciation expense accounting for the majority of the total increase for the year ended December 31, 2013. Depreciation of the newly acquired Pinedale LGS and related acquisition costs accounted for $8.7 million of the $10.4 million increase for the year ended December 31, 2013, as compared to the year ended November 30, 2012. PNM depreciation increased by $1.6 million for the for the year ended December 31, 2013 due to a change in accounting estimate, which is further discussed in Footnote 4 of the Notes to the Consolidated Financial Statements. Depreciation for Omega remained relatively flat between the years ended November 30, 2012 and December 31, 2013, as there were no major acquisitions or disposals of property, plant or equipment. Depreciation expense of approximately $837 thousand and $294 thousand was incurred on our EIP leased property for the fiscal years ended 2012 and 2011, respectively. The lease was acquired in June of 2011 and as such, there were only five months of depreciation expense for the fiscal year 2011.
Interest Expense
Interest expense was approximately $3.3 million for the year ended December 31, 2013 as compared to $81 thousand for the year ended November 30, 2012. The increase is mostly attributable to the $70 million credit facility, which was used to partially fund the Pinedale LGS acquisition, resulting in additional interest costs of approximately $3.3 million for the year ended December 31, 2013. In connection with the credit facility, we executed interest rate swap derivatives to add stability to our interest expense and to manage our exposure to interest rate movements on our LIBOR-based borrowings. Interest rate swaps involve the receipt of variable-rate amounts from a counterparty in exchange for us making fixed-rate payments over the life of the agreements without exchange of the underlying notional amount. (See Note 12 of the Notes to the Consolidated Financial Statements for further information regarding interest rate swap derivatives.) A mark-to-market adjustment to the value of the derivatives resulted in noncash charges to interest expense of $40 thousand for the year ended December 31, 2013. The remaining increase is related to cash settlements in connection with the derivatives and amortization of debt issuance cost. Interest expense for the year ended November 30, 2012 consisted of interest on PNM debt and margin loan fees on the Company's line of credit and Mowood's credit facility. The PNM debt and margin loan were both extinguished during 2012. Interest expense was approximately $45 thousand higher during fiscal year 2012 than 2011. Margin loan related interest fees for the Company's line of credit totaled approximately $25 thousand more in 2012. Mowood's interest related to its credit facility for the fiscal years 2012 and 2011 was approximately $26 thousand and $6 thousand, respectively.
Non-Controlling Interest Attributable to Depreciation, Amortization and Interest Expense
Due to Prudentials 18.95 percent ownership interest in Pinedale LP, the Company must make adjustments for non-controlling interests. Non-controlling interest attributable to depreciation, amortization and interest expense items was $2.27 million for the year ended December 31, 2013.
Net Income Attributable to CORR Stockholders
Income before income taxes attributable to CORR stockholders (after excluding items attributable to Prudential's non-controlling interest as described above) for the year ended December 31, 2013 was $7.5 million as compared to income before taxes of $19.1 million for the year ended November 30, 2012. The decrease in income is primarily related to the operational changes inherent during the transition from a business development company to a REIT. The decrease in net realized and unrealized gains on securities as well as the change in composition of our investment portfolio accounts for the majority of the fluctuation from the prior year. At the time we sold certain securities in the first quarter of 2013, we estimated their tax characteristics. Final tax information was provided during the second quarter of 2013, and we recognized additional tax expense related to gains on the sale. Net income attributable to common stockholders was $4.5 million, or $0.19 per common share, for the year ended December 31, 2013 as compared to $12.3 million, or $1.34 per common share, for the year ended November 30, 2012. Net income attributable to common stockholders was $2.9 million, or $0.32 per common share, for the year ended November 30, 2011.
Results of Operations for the One-Month Transition Period Ended December 31, 2012 and the Comparative One-Month Period Ended December 31, 2011
On February 5, 2013, the Board of Directors of the Company approved a change in the Company's fiscal year end from November 30 to December 31. This change to the calendar year reporting cycle began January 1, 2013. As a result of the change, the Company is reporting a December 2012 fiscal month transition period, which is separately reported in this Annual Report on Form 10-K for the calendar year ending December 31, 2013.
Following is a comparison of lease revenues, security distributions, operating results, expenses, other income and expense, and income (loss) before income taxes for the one-month transition period ended December 31, 2012 and the comparative one-month period ended December 31, 2011:
|
| | | | | | | | |
| | For the One-Month Transition Periods Ended |
| | December 31, 2012 | | December 31, 2011 |
Lease Revenue, Security Distributions, and Operating Results | | | | |
Leases: | | | | |
Lease revenue | | $ | 857,909 |
| | $ | 212,748 |
|
| | | | |
Other Equity Securities: | | | | |
Net cash distributions received | | 2,325 |
| | 119,275 |
|
| | | | |
Operations: | | | | |
Sales revenue | | 868,992 |
| | 866,864 |
|
Cost of sales | | (686,976 | ) | | (719,686 | ) |
Operating expenses, excluding depreciation and amortization | | (48,461 | ) | | (51,283 | ) |
Net Operations, excluding depreciation and amortization | | 133,555 |
| | 95,895 |
|
| | | | |
Total Lease Revenue, Security Distributions, and Operating Results | | $ | 993,789 |
| | $ | 427,918 |
|
| | | | |
Expenses | | (589,661 | ) | | (140,744 | ) |
Non-controlling interest attributable to adjusted EBITDA items | | (113,448 | ) | | — |
|
| | | | |
Adjusted EBITDA attributable to CORR Stockholders | | $ | 290,680 |
| | $ | 287,174 |
|
Other Income (Expense): | | | | |
Other Equity Securities: | | | | |
Net distributions and dividend income not recorded as income | | — |
| | (89,153 | ) |
Net realized and unrealized gain (loss) on securities | | (1,928,553 | ) | | 1,578,046 |
|
Net Other Equity Securities | | (1,928,553 | ) | | 1,488,893 |
|
| | | | |
Depreciation, Amortization and Interest Expense: | | | | |
Depreciation & amortization | | (501,324 | ) | | (82,206 | ) |
Interest expense, net | | (416,137 | ) | | (7,084 | ) |
Attributable to non-controlling interest | | 131,795 |
| | — |
|
Net Depreciation, Amortization and Interest Expense | | (785,666 | ) | | (89,290 | ) |
| | | | |
Total Other Income (Expense): | | (2,714,219 | ) | | 1,399,603 |
|
| | | | |
Income (loss) before Income Taxes Attributable to CORR stockholders | | (2,423,539 | ) | | 1,686,777 |
|
| | | | |
Income Tax Expense | | 920,143 |
| | (628,493 | ) |
Income (loss) attributable to CORR stockholders | | $ | (1,503,396 | ) | | $ | 1,058,284 |
|
| | | | |
Adjusted EBITDA per share (basic and diluted) | | $ | 0.02 |
| | $ | 0.03 |
|
Net earnings (loss) per share (basic and diluted) | | $ | (0.10 | ) | | $ | 0.12 |
|
Lease Revenue, Security Distributions, and Operating Results
Total lease revenue, security distributions, and operating results for the one-month transition period ended December 31, 2012 and 2011, were approximately $994 thousand and $428 thousand, respectively. The 2012 lease revenue includes lease revenue from the Pinedale LGS investment beginning December 20, 2012, which primarily accounts for the $645 thousand difference between periods. Cash distributions received from investments decreased approximately $117 thousand, due to the Company liquidating its portfolio of trading securities in December 2012. Operating results related to Mowood operations for the one-month transition period ended December 31, 2012 as compared to the one-month transition period ended December 31, 2011 was $38 thousand different. Sales revenue related to Mowood operations for the one-month transition period ended December 31, 2012 and 2011 was fairly level at $869 thousand. Cost of sales for the one-month transition period ended December 31, 2012 and 2011
were $687 thousand and $720 thousand, respectfully. The $33 thousand difference between periods results from the lower gas usage rates in the winter of 2012. Operating expense remained level for the one-month transition period ended December 31, 2012 and 2011 at approximately $48 thousand.
Expenses
Total reported expenses from operations for the one-month transition period ended December 31, 2012 and 2011 were approximately $590 thousand and $141 thousand, respectively. The variance is due to expenses incurred during the acquisition of the Pinedale LGS. The most significant components of the variation are outlined in the following table:
|
| | | | | | | | | | | |
Expenses from Operations |
| For the One-Month Transition Period Ended December 31, 2012 | | For the Comparative One-Month Period Ended December 31, 2011 | | Increase |
Management fees, net of expense reimbursements | $ | 155,242 |
| | $ | 81,081 |
| | $ | 74,161 |
|
Asset acquisition expense | 64,733 |
| | — |
| | 64,733 |
|
Professional fees/directors’ fees/other | 369,686 |
| | 59,663 |
| | 310,023 |
|
Total | $ | 589,661 |
| | $ | 140,744 |
| | $ | 448,917 |
|
Management fees, asset acquisition expense and professional fees, directors' fees, other expenses for the one-month transition period ended December 31, 2012 totaled $155 thousand, $65 thousand, and $370 thousand, respectively. Management fees, asset acquisition expense and professional fees, directors' fees, other expenses for the comparative one-month period ended December 31, 2011 totaled $81 thousand, $0, and $60 thousand, respectfully. The variance of $449 thousand is primarily due to additional expenditures associated with the acquisition of the Pinedale LGS.
Non-Controlling Interest Attributable to Adjusted EBITDA Items
Due to Prudential's 18.95 percent ownership interest in Pinedale LP, the Company must make adjustments for non-controlling interests. Adjusted EBITDA items attributable to Prudential's non-controlling interest was $132 thousand for the one-month transition period ending December 31, 2012.
Adjusted EBITDA Attributable to CORR Stockholders
Adjusted EBITDA attributable to CORR Stockholders for the one-month transition period ended December 31, 2012 and the comparative one-month period ended December 31, 2011 was $291 thousand and $287 thousand, respectfully. The increase in adjusted EBITDA is primarily related to the acquisition of the Pinedale LGS.
Other Income and Expense
Total other income, net, for the one-month transition period ended December 31, 2012 decreased $4.1 million, as compared to the comparative one-month period ended December 31, 2011. Other income and expense consists of four primary components: Return of Capital Distributions and Dividend Income; Realized and Unrealized Gains and Losses from Securities; Depreciation and Amortization Expense; and Interest Expense. The two largest contributors to the decrease from prior year is the decrease in realized and unrealized gains and losses on securities and the increase in depreciation expense. The decrease in realized and unrealized gains and losses on securities is a result of our exit from investments in MLP equities. The increase in depreciation expense is due primarily to the acquisition of the Pinedale LGS in December 2012. The following discussion expands on the impact of each of the four components on other income and expense.
Net Distributions and Dividend Income Not Recorded as Income
The following table summarizes the breakout of net distributions and dividends reported as income (loss) on the income statement. The table shows the gross distributions and dividend income received from our investment securities on a cash basis, less the amounts that were comprised of distributions and dividends not reported in income received from investment securities (return of capital):
|
| | | | | | | |
Gross Distributions and Dividend Income Received From Investment Securities |
| For the One-Month Transition Period Ended | | For the One-Month Period Ended |
| December 31, 2012 | | December 31, 2011 |
Distributions and dividend income received from investment securities | $ | 2,325 |
| | $ | 119,275 |
|
Less: distributions and dividends not reported in income (recorded as a cost reduction) | — |
| | (89,153 | ) |
Net distributions and dividends reported as income (loss) | $ | 2,325 |
| | $ | 30,122 |
|
Net Realized and Unrealized Gains and Losses on Securities
The decrease in realized and unrealized gains and (losses) from trading and other equity securities for the one-month transition period ended December 31, 2012 and the comparative one-month period ended December 31, 2011 totaled $(1.9) million and $1.6 million, respectively. During 2011, our income was still primarily derived from our portfolio of trading and other equity securities. By the end of 2012, we had liquidated the majority of our trading securities and had acquired the Pinedale LGS, now our largest source of income.
Depreciation and Amortization
The acquisition of the Pinedale LGS drove the increase in costs, with Pinedale depreciation expense accounting for the majority of the total increase for the one month transition period ended December 31, 2012.
Depreciation expense increased by $417 thousand between periods. This increase is mainly due to the depreciation incurred for Pinedale LGS asset, which was $286 thousand for the one-month transition period ended December 31, 2012. PNM depreciation increased by $131 thousand for the one-month transition period ended December 31, 2012 to the comparative one-month period ended December 31, 2011, see Footnote 4 for further discussion. Mowood's depreciation remained level between periods at $24 thousand as there were no major acquisitions or disposals of property, plant, or equipment.
Interest Expense
Interest expense was approximately $416 thousand and $7 thousand for the one-month transition period ended December 31, 2012 and the one-month transition period ended December 31, 2011, respectively. The increase is attributable to the $70 million credit facility, which was used to partially fund the Pinedale LGS acquisition, resulting in additional interest costs.
Non-Controlling Interest Attributable to Depreciation, Amortization and Interest Expense
Due to Prudentials 18.95 percent ownership interest in Pinedale LP, the Company must make adjustments for non-controlling interests. Non-controlling interest attributable to depreciation, amortization and interest expense items was $113 thousand for the one-month transition period ended December 31, 2012.
Net Income
Income (loss) before income taxes for the one-month transition period ended December 31, 2012 was $(2.4) million. Income (loss) before income taxes for the comparative one-month period ended December 31, 2011 was $1.7 million. December 2012 was a month of transition as the company liquidated its trading securities portfolio resulting in losses that were only somewhat offset by a partial month of lease revenues from the newly acquired Pinedale LGS leased asset.
Book Value per Share
|
| | | | | | | | | | | | | | | |
Analysis of Equity | December 31, 2013 | | November 30, 2012 | | November 30, 2011 | | December 31, 2012 |
Warrants, no par value; 945,594 issued and outstanding at December 31, 2013, November 30, 2012, and December 31, 2012 (5,000,000 authorized) | $ | 1,370,700 |
| | $ | 1,370,700 |
| | $ | 1,370,700 |
| | $ | 1,370,700 |
|
Capital stock, non-convertible, $0.001 par value; 24,156,163 shares issued and outstanding at December 31, 2013, 9,190,667 shares issued and outstanding at November 30, 2012, and 24,140,667 shares issued and outstanding at December 31, 2012 (100,000,000 shares authorized) | 24,156 |
| | 9,191 |
| | 9,177 |
| | 24,141 |
|
Additional paid-in capital | 173,441,019 |
| | 91,763,475 |
| | 95,682,738 |
| | 175,256,675 |
|
Accumulated retained earnings (deficit) | 1,580,062 |
| | 5,712,419 |
| | (6,636,302 | ) | | 4,209,023 |
|
Accumulated other comprehensive income | 777,403 |
| | — |
| | — |
| | — |
|
Total CorEnergy Equity | 177,193,340 |
| | 98,855,785 |
| | 90,426,313 |
| | 180,860,539 |
|
Shares outstanding | 24,156,163 |
| | 9,190,667 |
| | 9,176,889 |
| | 24,140,667 |
|
Book Value per Share | $ | 7.3353 |
| | $ | 10.7561 |
| | $ | 9.8537 |
| | $ | 7.4919 |
|
As of December 31, 2013, our equity increased by approximately $78.3 million to $177.2 million from $98.9 million as of November 30, 2012. This increase principally consisted of net proceeds from our December 2012 share offering of approximately $83 million, and a net increase in equity resulting from operations for the year ended December 31, 2013 of approximately $5 million, partially offset by a decrease due to dividends paid of approximately $9.0 million. CorEnergy equity was $177.2 million as of December 31, 2013.
FFO
As defined by the National Association of Real Estate Investment Trusts, FFO represents net income (computed in accordance with GAAP), excluding gains (or losses) from sales of depreciable operating property, real estate-related depreciation and amortization (excluding amortization of deferred financing costs or loan origination costs) and after adjustments for unconsolidated partnerships and joint ventures. FFO is a supplemental, non-GAAP financial measure.
We present FFO because we consider it an important supplemental measure of our operating performance and believe that it is frequently used by securities analysts, investors and other interested parties in the evaluation of REITs, many of which present FFO when reporting their results. FFO is a key measure used by Corridor in assessing performance and in making resource allocation decisions.
FFO is intended to exclude GAAP historical cost depreciation and amortization of real estate and related assets, which assumes that the value of real estate diminishes ratably over time. Historically, however, real estate values have risen or fallen with market conditions, and that may also be the case with the energy infrastructure assets which we expect to acquire. Because FFO excludes depreciation and amortization unique to real estate, gains and losses from property dispositions and extraordinary items, it provides a performance measure that, when compared year over year, reflects the impact to operations from trends in base and participating rent, company operating costs, development activities and interest costs, thereby providing perspective not immediately apparent from net income.
We calculate FFO in accordance with standards established by the Board of Governors of the National Association of Real Estate Investment Trusts, in its March 1995 White Paper (as amended in November 1999 and April 2002), which may differ from the methodology for calculating FFO utilized by other equity REITs and, accordingly may not be comparable to such other REITs. FFO does not represent amounts available for management's discretionary use because of needed capital for replacement or expansion, debt service obligations or other commitments and uncertainties. FFO should not be considered as an alternative to net income (loss) (computed in accordance with GAAP), as an indicator of our financial performance or to cash flow from operating activities (computed in accordance with GAAP), as an indicator of our liquidity, or as an indicator of funds available for our cash needs, including our ability to make distributions or to service our indebtedness.
AFFO
AFFO is a supplemental, non-GAAP financial measure which we define as FFO plus transaction costs, amortization of debt issuance costs, deferred leasing costs, above market rent, and certain costs of a nonrecurring nature, less maintenance, capital expenditures (if any), amortization of debt premium and adjustments to lease revenue resulting from the EIP sale. Management uses AFFO as a measure of long-term sustainable operational performance.
We target a total return of 8 percent to 10 percent per annum on the infrastructure assets that we own, measured over the long term. We intend to generate this return from the base rent of our leases plus growth through acquisitions and participating portions
of our rent. If we are successful growing our AFFO per share of common stock, we anticipate being able to increase distributions to our stockholders. In addition, the increase in our AFFO per share of common stock should result in capital appreciation. For our business as a whole, a key performance measure is AFFO yield, defined as AFFO divided by invested capital, which measures the sustainable return on capital that we have deployed.
AFFO does not represent amounts available for management's discretionary use because such amounts are needed for capital replacement or expansion, debt service obligations or other commitments and uncertainties. AFFO should not be considered as an alternative to net income (loss) (computed in accordance with GAAP), as an indicator of our financial performance or to cash flow from operating activities (computed in accordance with GAAP), as an indicator of our liquidity, or as an indicator of funds available for our cash needs, including our ability to make distributions or service our indebtedness.
In light of the per share AFFO growth that we foresee in our operations, we are targeting 1 percent to 3 percent annual dividend growth. We can provide no assurances regarding our total return or annual dividend growth. See "Risk Factors" for a discussion of the many factors that may affect our ability to make distributions at targeted rates, or at all.
The following table presents a comparison of FFO and AFFO for each of the calendar quarters of 2013:
|
| | | | | | | | | | | | | | | | |
FFO and AFFO Reconciliation |
| | For the Three Months Ended |
| | December 31, 2013 | | September 30, 2013 | | June 30, 2013 | | March 31, 2013 |
Net Income (attributable to CorEnergy Stockholders): | | $ | 1,580,062 |
| | $ | 439,452 |
| | $ | 70,072 |
| | $ | 2,412,753 |
|
Add: | | | | | | | | |
Depreciation | | 2,858,120 |
| | 2,857,412 |
| | 2,857,412 |
| | 2,857,036 |
|
Distributions received from investment securities | | 647,405 |
| | 510,965 |
| | 317,184 |
| | 314,339 |
|
Income tax expense, net | | 581,695 |
| | 1,105,125 |
| | 241,754 |
| | 1,020,944 |
|
Less: | | | | | | | | |
Net distributions and dividend income | | — |
| | 567,276 |
| | — |
| | — |
|
Net realized and unrealized gain (loss) on trading securities | | — |
| | (567,276 | ) | | — |
| | 316,063 |
|
Net realized and unrealized gain (loss) on other equity securities | | 1,783,460 |
| | 1,439,296 |
| | (30,976 | ) | | 2,425,986 |
|
Non-Controlling Interest attributable to FFO reconciling items | | 411,455 |
| | 411,384 |
| | 411,384 |
| | 411,378 |
|
Funds from operations (FFO) | | 3,472,367 |
| | 3,062,274 |
| | 3,106,014 |
| | 3,451,645 |
|
Add: | | | | | | | | |
Transaction costs | | 80,570 |
| | 640,302 |
| | 53,394 |
| | 31,817 |
|
Amortization of debt issuance costs | | 170,888 |
| | 128,618 |
| | 128,320 |
| | 128,474 |
|
Amortization of deferred lease costs | | 15,342 |
| | 15,342 |
| | 15,342 |
| | 15,279 |
|
Amortization of above market leases | | 72,985 |
| | 72,985 |
| | 72,985 |
| | 72,985 |
|
Noncash costs associated with derivative instruments | | (17,920 | ) | | (16,990 | ) | | 71,850 |
| | 3,350 |
|
Nonrecurring personnel costs | | — |
| | — |
| | 113,232 |
| | — |
|
Less: | | | | | | | | |
EIP Lease Adjustment | | 542,809 |
| | 542,809 |
| | 542,809 |
| | 542,809 |
|
Non-Controlling Interest attributable to AFFO reconciling items | | 23,088 |
| | 23,138 |
| | 48,880 |
| | 26,330 |
|
Adjusted funds from operations (AFFO) | | $ | 3,228,335 |
| | $ | 3,336,584 |
| | $ | 2,969,448 |
| | $ | 3,134,411 |
|
| | | | | | | | |
Weighted Average Shares | | 24,421,474 |
| | 24,151,700 |
| | 24,147,958 |
| | 24,141,720 |
|
FFO per share | | $ | 0.14 |
| | $ | 0.13 |
| | $ | 0.13 |
| | $ | 0.14 |
|
AFFO per share | | $ | 0.13 |
| | $ | 0.14 |
| | $ | 0.12 |
| | $ | 0.13 |
|
FFO
FFO for the three months ended December 31, 2013 totals approximately $3.5 million. FFO was calculated in accordance with the National Association of Real Estate Investment Trust's definition, above. In addition, we have made adjustments for noncash items impacting net income for the three months ended December 31, 2013 by eliminating a net realized and unrealized gain on other equity securities of approximately $1.8 million; adding distributions received from investment securities of approximately $647 thousand; and adding back income tax expense of approximately $582 thousand.
AFFO
AFFO for the three months ended December 31, 2013 totals approximately $3.2 million. In addition to the adjustments outlined in the AFFO definition above, we have included an adjustment to deduct lease revenue associated with the EIP investment. Based on the economic return to CorEnergy resulting from the sale of our 40 percent undivided interest in EIP, we determined that it was appropriate to eliminate the portion of EIP lease income attributable to return of capital, as a means to more accurately reflect EIP lease revenue contribution to CorEnergy-sustainable FFO. CorEnergy believes that the portion of the EIP lease revenue attributable to return of capital, unless adjusted, overstates CorEnergy's distribution-paying capabilities and is not representative of sustainable EIP income over the life of the lease.
The following table presents a comparison of FFO and AFFO, for the historical years ended December 31, 2013 and November 30, 2012:
|
| | | | | | | | |
FFO and AFFO Reconciliation | | | | |
| | Historical for the Year Ended December 31, 2013 | | Historical for the Year Ended November 30, 2012 |
Net Income (attributable to CorEnergy Stockholders): | | $ | 4,502,339 |
| | $ | 12,348,721 |
|
Add: | | | | |
Depreciation | | 11,429,980 |
| | 1,118,269 |
|
Distributions received from investment securities | | 1,789,893 |
| | 4,985,370 |
|
Income tax expense, net | | 2,949,518 |
| | 7,228,934 |
|
Less: | | | | |
Net distributions and dividend income | | 567,276 |
| | — |
|
Net realized and unrealized gain (loss) on trading securities | | (251,213 | ) | | 4,009,933 |
|
Net realized and unrealized gain (loss) on other equity securities | | 5,617,766 |
| | 16,171,944 |
|
Non-Controlling Interest attributable to FFO reconciling items | | 1,645,601 |
| | — |
|
Funds from operations (FFO) | | 13,092,300 |
| | 5,499,417 |
|
Add: | | | | |
Transaction costs | | 806,083 |
| | 377,834 |
|
Amortization of debt issuance costs | | 556,300 |
| | — |
|
Amortization of deferred lease costs | | 61,305 |
| | — |
|
Amortization of above market leases | | 291,940 |
| | 291,939 |
|
Noncash costs associated with derivative instruments | | 40,290 |
| | — |
|
Nonrecurring personnel costs | | 113,232 |
| | — |
|
Less: | | | | |
EIP Lease Adjustment | | 2,171,236 |
| | 2,171,238 |
|
Non-Controlling Interest attributable to AFFO reconciling items | | 121,436 |
| | — |
|
Amortization of debt premium | | — |
| | 91,883 |
|
Adjusted funds from operations (AFFO) | | $ | 12,668,778 |
| | $ | 3,906,069 |
|
| | | | |
Weighted Average Shares | | 24,149,396 |
| | 9,182,425 |
|
FFO per share | | $ | 0.54 |
| | $ | 0.60 |
|
AFFO per share | | $ | 0.52 |
| | $ | 0.43 |
|
FFO
FFO for the the year ended December 31, 2013 totals approximately $13.1 million. FFO was calculated in accordance with the National Association of Real Estate Investment Trust's definition, above. In addition, we have made adjustments for noncash items impacting net income for the year ended December 31, 2013 by eliminating a net realized and unrealized gain on other equity
securities of approximately $5.6 million; eliminating net realized and unrealized loss on trading securities of $251 thousand; adding distributions received from investment securities of approximately $1.8 million; and adding back income tax expense of approximately $2.9 million.
AFFO
AFFO for the year ended December 31, 2013 totals approximately $12.7 million. In addition to the adjustments outlined in the AFFO definition above, we have included an adjustment to back out lease revenue associated with the EIP investment. Based on the economic return to CorEnergy resulting from the sale of our 40 percent undivided interest in EIP, we determined that it was appropriate to eliminate the portion of EIP lease income attributable to return of capital, as a means to more accurately reflect EIP lease revenue contribution to CorEnergy-sustainable FFO. CorEnergy believes that the portion of the EIP lease revenue attributable to return of capital, unless adjusted, overstates CorEnergy's distribution-paying capabilities and is not representative of sustainable EIP income over the life of the lease.
PRO FORMA RESULTS OF OPERATIONS ILLUSTRATING THE EFFECTS OF THE PORTLAND TERMINAL FACILITY ACQUISITION
The following unaudited pro forma condensed consolidated results of operations and underlying pro forma adjustments are based upon currently available information and certain estimates and assumptions made by management; therefore, actual results could differ materially from the pro forma information. However, we believe the assumptions provide a reasonable basis for presenting the significant effects of the transactions noted herein. We believe the pro forma adjustments give appropriate effect to those assumptions and are properly applied in the pro forma information. The pro forma adjustments reflect the changes in the results of operations if the Company had acquired and leased the Portland Terminal Facility on January 1, 2013.
Following is a comparison of lease revenues, security distributions, operating results, expenses, other income and expense, and income (loss) before income taxes for the historical year ended December 31, 2013 and, after making the pro forma adjustments explained below to reflect our acquisition and lease of the Portland Terminal Facility as if it had occurred on January 1, 2013, for the pro forma year ended December 31, 2013:
|
| | | | | | | | | | | | |
| | For the Years Ended December 31, 2013 |
| | Historical | | Pro Forma Adjustments | | Pro Forma Combined |
Lease Revenue, Security Distributions, and Operating Results | | | | | | |
Leases: | | | | | | |
Lease revenue | | $ | 22,552,976 |
| | $ | 5,319,021 |
| | $ | 27,871,997 |
|
Other Equity Securities: | | | | | | |
Net cash distributions received | | 1,807,429 |
| | — |
| | 1,807,429 |
|
Operations: | | | | | | |
Sales revenue | | 8,733,044 |
| | — |
| | 8,733,044 |
|
Cost of sales | | (6,734,665 | ) | | — |
| | (6,734,665 | ) |
Operating expenses (excluding depreciation and amortization) | | (924,571 | ) | | — |
| | (924,571 | ) |
Net Operations (excluding depreciation and amortization) | | 1,073,808 |
| | — |
| | 1,073,808 |
|
| | | | | | |
Total Lease Revenue, Security Distributions, and Operating Results | | $ | 25,434,213 |
| | $ | 5,319,021 |
| | $ | 30,753,234 |
|
| | | | | | |
Expenses | | (5,879,864 | ) | | (412,962 | ) | | (6,292,826 | ) |
Non-Controlling Interest Attributable to Adjusted EBITDA Items | | (3,734,884 | ) | | — |
| | (3,734,884 | ) |
| | | | | | |
Adjusted EBITDA Attributable to CORR Stockholders | | $ | 15,819,465 |
| | $ | 4,906,059 |
| | $ | 20,725,524 |
|
Other Income (Expense): | | | | | | |
Other Equity Securities: | | | | | | |
Net distributions and dividend income not recorded as income | | (1,222,615 | ) | | — |
| | (1,222,615 | ) |
Net realized and unrealized gain on securities | | 5,366,553 |
| | — |
| | 5,366,553 |
|
Net Other Equity Securities | | 4,143,938 |
| | — |
| | 4,143,938 |
|
Depreciation, Amortization, and Interest Expense: | | | | | | |
Depreciation & amortization | | (11,491,285 | ) | | (1,376,541 | ) | | (12,867,826 | ) |
Interest expense, net | | (3,288,378 | ) | | — |
| | (3,288,378 | ) |
Non-controlling interest attributable to depreciation, amortization and interest expense | | 2,268,117 |
| | — |
| | 2,268,117 |
|
Net Depreciation, Amortization and Interest Expense | | (12,511,546 | ) | | (1,376,541 | ) | | (13,888,087 | ) |
| | | | | | |
Total Other Income (Expense): | | (8,367,608 | ) | | (1,376,541 | ) | | (9,744,149 | ) |
| | | | | | |
Income before Income Taxes Attributable to CORR stockholders | | 7,451,857 |
| | 3,529,518 |
| | 10,981,375 |
|
| | | | | | |
Income tax expense | | (2,949,518 | ) | | — |
| | (2,949,518 | ) |
Income Attributable to CORR Stockholders | | $ | 4,502,339 |
| | $ | 3,529,518 |
| | $ | 8,031,857 |
|
| | | | | | |
Adjusted EBITDA per share (basic and diluted) | | $ | 0.66 |
| | N/A |
| | $ | 0.66 |
|
Net earnings per share (basic and diluted) | | $ | 0.19 |
| | N/A |
| | $ | 0.25 |
|
AFFO per share (basic and diluted)(1) | | $ | 0.52 |
| | N/A |
| | $ | 0.56 |
|
Book value per share (basic and diluted) (2) | | $ | 7.34 |
| | N/A |
| | $ | 7.06 |
|
(1)For a full reconciliation of historical AFFO per share (basic and diluted) to Income Attributable to CORR Stockholders, see FFO/AFFO Reconciliation table presented herein.
(2)For a full reconciliation of historical book value per share (basic and diluted) to Income Attributable to CORR Stockholders, see Book Value Per Share table presented herein.
Lease Revenue, Security Distributions and Operating Results
Lease revenue, security distributions and operating results for the historical year ended December 31, 2013 was $25.4 million. The amount of incremental pro forma lease revenue for the year ended December 31, 2013 is $5.3 million. This results in pro forma lease revenue of $27.9 million for the pro forma year ended December 31, 2013. At conclusion of the Portland Terminal Facility construction project, the average Portland Lease Agreement revenue will increase by approximately $1.2 million to $6.5 million annually.
Expenses
Total expenses for the historical year ended December 31, 2013 and the pro forma year ended December 31, 2013 were $5.9 million and $6.3 million, respectively. Total pro forma expenses from operations for the year ended December 31, 2013 were $413 thousand. This represents the adjustment for a 1 percent annual management fee payable to our external manager, Corridor, on approximately $41.3 million of additional managed assets.
Non-Controlling Interest Attributable to Adjusted EBITDA Items
Non-controlling interest attributable to adjusted EBITDA items for the historical year ended December 31, 2013 was $3.7 million. There were no pro forma adjustments for non-controlling interest attributable to adjusted EBITDA items for the year ended December 31, 2013 because the Company owns 100 percent of the Portland Terminal Facility.
Adjusted EBITDA Attributable to CORR Stockholders
Adjusted EBITDA attributable to CORR stockholders for the historical year ended December 31, 2013 and the pro forma year ended December 31, 2013 were $15.8 million and $20.7 million, respectively. The net pro forma adjustments for the Portland Terminal Facility acquisition for adjusted EBITDA attributable to CORR stockholders were $4.9 million, as detailed above under "Lease Revenue, Security Distributions and Operating Results and Expenses."
Other Income and Expense
Total other income (expense), net, for the historical year ended December 31, 2013 and the pro forma year ended December 31, 2013 were $(8.4) million and $(9.7) million, respectively. The pro forma decreased $1.4 million, as compared to the historical year ended December 31, 2013, is due to increased depreciation from the acquisition of the Portland Terminal Facility. Other income and expense consists of four primary components: Return of Capital Distributions and Dividend Income; Realized and Unrealized Gains and Losses from Securities; Depreciation and Amortization; and Interest Expense. The following discussion expands on the impact of each of the four components on other income and expense.
Net Distributions and Dividend Income Not Recorded as Income
Net distributions and dividend income not recorded as income for the historical year ended December 31, 2013 was $(1.2) million. There were no pro forma adjustments for Net Distributions and Dividend Income Not Recorded as Income for the pro forma year ended December 31, 2013.
Net Realized and Unrealized Gains and Losses on Securities
Net realized and unrealized gains and losses on securities for the historical year ended December 31, 2013 was $5.4 million. There were no pro forma adjustments for Net Realized and Unrealized Gains and Losses on Securities for the pro forma year ended December 31, 2013 because the Company did not buy or sell any securities in connection with the Portland Terminal Facility acquisition.
Depreciation and Amortization
Depreciation and amortization for the historical year ended December 31, 2013 and the pro forma year ended December 31, 2013 were $11.5 million and $12.9 million, respectively. For the pro forma year ended December 31, 2013, depreciation of the Portland Terminal Facility assets and related acquisition costs accounted for the $1.4 million increase as compared to the historical year ended December 31, 2013.
Interest Expense
Interest expense for the historical year ended December 31, 2013 was $3.3 million. There were no pro forma adjustments for interest expense for the pro forma year ended December 31, 2013 because the Company did not issue any additional debt to fund the Portland Terminal Facility acquisition.
Non-Controlling Interest Attributable to Depreciation, Amortization and Interest Expense
Non-controlling interest attributable to depreciation, amortization and interest expense for the historical year ended December 31, 2013 was $2.3 million. There were no pro forma adjustments for non-controlling interest attributable to depreciation, amortization and interest expense for the pro forma year ended December 31, 2013 because the Company owns 100 percent of the Portland Terminal Facility.
Net Income Attributable to CORR Stockholders
Income before income taxes for the historical year ended December 31, 2013 and the pro forma year ended December 31, 2013 were $7.5 million and $11.0 million, respectively. The acquisition of the Portland Terminal Facility accounts for an increase in income before taxes of $3.5 million for the pro forma year ended December 31, 2013. Net income attributable to common stockholders for the historical year ended December 31, 2013 and the pro forma year ended December 31, 2013 were $4.5 million and $8.0 million, respectively, or $0.19 per common share and $0.25 per common share, respectively. There was no income tax expense adjustment for the pro forma year ended December 31, 2013 because the Company has qualified as a REIT for 2013 and will generally not pay income taxes on qualified transactions. The Company believes the acquisition of the Portland Terminal Facility was a qualifying transaction for REIT purposes.
Pro Forma Capitalization Table
The following capitalization table sets forth the Company's capitalization on a historical basis as of December 31, 2013, and on an adjusted basis pro forma for the Portland Terminal Facility acquisition public stock offering, as if it had occurred on December 31, 2013. On January 21, 2014, the Company closed a follow on public offering of 7,475,000 shares of common stock, raising approximately $49 million in gross proceeds at $6.50 per share (net proceeds of approximately $46 million after underwriters’ discount). The number of shares includes additional shares that were sold pursuant to an over-allotment option granted to the underwriters of CorEnergy’s public offering of 6,500,000 shares. The net proceeds from this offering were used to finance the Portland Terminal Facility acquisition $40 million acquisition price plus $1.4 million of asset acquisition expenses.
|
| | | | | | | | | | | | |
| | For the Years Ended December 31, 2013 |
| | Historical | | As Adjusted | | Pro Forma as Adjusted |
Cash | | $ | 17,963,266 |
| | $ | 64,015,766 |
| | $ | 22,719,544 |
|
Debt: | | | | | | |
Long-term debt | | 70,000,000 |
| | 70,000,000 |
| | 70,000,000 |
|
Total Debt | | 70,000,000 |
| | 70,000,000 |
| | 70,000,000 |
|
Stockholders' Equity | | | | | | |
Warrants, no par value; 945,594 issued and outstanding at December 31, 2013 (5,000,000 authorized) | | 1,370,700 |
| | 1,370,700 |
| | 1,370,700 |
|
Capital stock, non-convertible, $0.001 par value; 24,156,163 and 30,651,870 shares issued and outstanding, actual and pro forma as adjusted (100,000,000 shares authorized) | | 24,156 |
| | 31,631 |
| | 31,631 |
|
Additional paid-in capital | | 173,441,019 |
| | 219,486,044 |
| | 219,486,044 |
|
Accumulated retained earnings | | 1,580,062 |
| | 1,580,062 |
| | 1,580,062 |
|
Accumulated other comprehensive income | | 777,403 |
| | 777,403 |
| | 777,403 |
|
Total Stockholders' Equity | | 177,193,340 |
| | 223,245,840 |
| | 223,245,840 |
|
Total Capitalization | | $ | 247,193,340 |
| | $ | 293,245,840 |
| | $ | 293,245,840 |
|
Pro Forma FFO/AFFO
The following table presents FFO and AFFO for the proforma year ended December 31, 2013, after taking into account all of the pro forma adjustments described above. FFO and AFFO are defined in detail in the FFO/AFFO section above. The pro forma column assumes the completion, as of January 1, 2013, of the Portland Terminal acquisition actually completed January 21, 2014. The pro forma column therefore includes the purchase of the Portland Terminal Facility, execution of the Portland Lease Agreement, and the sale of 7.475 million shares of our common stock, which includes 975 thousand shares issued in the over-allotment option.
|
| | | | |
FFO and AFFO Reconciliation |
| | Pro Forma for the Year Ended December 31, 2013 |
Net Income (attributable to CorEnergy Stockholders): | | $ | 8,031,697 |
|
Add: | | |
Depreciation | | 12,806,348 |
|
Distributions received from investment securities | | 1,790,066 |
|
Income tax expense, net | | 2,949,518 |
|
Less: | | |
Net distributions and dividend income | | 567,276 |
|
Net realized and unrealized gain (loss) on trading securities | | (251,213 | ) |
Net realized and unrealized gain (loss) on other equity securities | | 5,617,766 |
|
Non-Controlling Interest attributable to FFO reconciling items | | 1,645,601 |
|
Funds from operations (FFO) | | 17,998,199 |
|
Add: | | |
Transaction costs | | 806,083 |
|
Amortization of debt issuance costs | | 556,300 |
|
Amortization of deferred lease costs | | 61,305 |
|
Amortization of above market leases | | 291,940 |
|
Noncash costs associated with derivative instruments | | 40,290 |
|
Nonrecurring personnel costs | | 113,232 |
|
Less: | | |
EIP Lease Adjustment | | 2,171,236 |
|
Amortization of debt premium | | 121,436 |
|
Adjusted funds from operations (AFFO) | | $ | 17,574,677 |
|
| | |
Weighted Average Shares | | 31,624,396 |
|
FFO per share | | $ | 0.57 |
|
AFFO per share | | $ | 0.56 |
|
FFO
Pro forma FFO for the year ended December 31, 2013 totals approximately $18 million. FFO was calculated in accordance with the National Association of Real Estate Investment Trust’s definition above. In addition, we have made adjustments for non-cash items impacting net income for the year ended December 31, 2013 by eliminating a net realized and unrealized gain on other equity securities of approximately $5.6 million; eliminating a net realized and unrealized loss on trading securities of approximately $251 thousand; adding distributions received from investment securities of approximately $1.8 million; and adding back income tax expense of approximately $2.9 million.
AFFO
Pro forma AFFO for the year ended December 31, 2013 totals approximately $17.6 million. In addition to the adjustments outlined in the AFFO definition above, we have included an adjustment to deduct lease revenue associated with the EIP investment. Based on the economic return to CorEnergy resulting from the sale of our 40 percent undivided interest in EIP, we determined that it was appropriate to eliminate the portion of EIP lease income attributable to return of capital, as a means to more accurately reflect EIP lease revenue contribution to CorEnergy-sustainable FFO. CorEnergy believes that the portion of the EIP lease revenue attributable to return of capital, unless adjusted, overstates CorEnergy's distribution-paying capabilities and is not representative of sustainable EIP income over the life of the lease.
FEDERAL AND STATE INCOME TAXATION
We elected to be treated as a REIT for federal income tax purposes (which we refer to as the “REIT Election”) for the calendar and tax year ended December 31, 2013. The Company satisfied the annual income test and the quarterly assets tests necessary for us to qualify to be taxed as a REIT for 2013. Because certain of our assets may not produce REIT-qualifying income or be treated as interests in real property, during December 2012 we contributed those assets into wholly-owned Taxable REIT Subsidiaries ("TRSs"). This was done in 2012 in order to limit the potential that such assets and income would prevent us from qualifying as a REIT for 2013. Due to the anticipated REIT Election, we changed our fiscal year end from November 30 to December 31.
For tax years ended December 31, 2012 or earlier, the Company is treated as a C corporation and is obligated to pay federal and state income tax on its taxable income. Currently, the highest regular marginal federal income tax rate for a corporation is 35 percent. The Company may be subject to a 20 percent federal alternative minimum tax on its federal alternative minimum taxable income to the extent that its alternative minimum tax exceeds its regular federal income tax. For years ended in 2012 and before, the distributions we made to our stockholders from our earnings and profits were treated as qualified dividend income ("QDI") and return of capital. QDI is taxed to our individual shareholders at the maximum rate for long-term capital gains, which prior to 2013 was 15 percent and after 2012 will be 20 percent.
The Company's trading securities and other equity securities are limited partnerships or limited liability companies which are treated as partnerships for federal and state income tax purposes. As a limited partner, the Company's TRSs report their allocable share of taxable income in computing The TRSs own taxable income. The Company's tax expense or benefit is included in the Consolidated Statements of Income based on the component of income or gains and losses to which such expense or benefit relates. Deferred income taxes reflect the net tax effects of temporary differences between the carrying amounts of assets and liabilities for financial reporting purposes and the amounts used for income tax purposes. A valuation allowance is recognized if, based on the weight of available evidence, it is more likely than not that some portion or all of the deferred income tax asset will not be realized.
The Company has elected to be taxed as a REIT for 2013 rather than a C corporation and generally will not pay federal income tax on taxable income that is distributed to our stockholders. As a REIT, our distributions from earnings and profits will be treated as ordinary income and a return of capital, and generally will not qualify as QDI. To the extent that the REIT had accumulated C corporation earnings and profits from the periods prior to 2013, we have distributed such earnings and profits in 2013. A portion of our normal distribution was characterized for federal income tax purposes as a distribution of those earnings and profits from non-REIT years and were treated as QDI.
We hold and operate certain of our assets through one or more wholly-owned taxable REIT subsidiaries. A TRS is a subsidiary of a REIT that is subject to applicable corporate income tax. Our use of TRSs enables us to continue to engage in certain businesses while complying with REIT qualification requirements and also allows us to retain income generated by these businesses for reinvestment without the requirement of distributing those earnings. In the future, we may elect to reorganize and transfer certain assets or operations from our TRSs to the Company or other subsidiaries, including qualified REIT subsidiaries.
If we cease to qualify as a REIT, the Company, as a C corporation, would be obligated to pay federal and state income tax on its taxable income. Currently, the highest regular marginal federal income tax rate for a corporation is 35 percent. The Company may be subject to a 20 percent federal alternative minimum tax on its federal alternative minimum taxable income to the extent that its alternative minimum tax exceeds its regular federal income tax.
SEASONALITY
The Company's wholly-owned subsidiary, Mowood, experiences a substantial amount of seasonality in gas sales. As a result, overall sales and operating income are generally higher in the first and fourth quarters and lower during the second and third quarters of each year. Due to the seasonal nature of Mowood, operating results for the interim periods are not necessarily indicative of the results that may be expected for the full year.
PORTFOLIO UPDATES
Eastern Interconnect Project
In connection with the sale of our 40 percent undividend interest in the EIP upon lease termination on April 1, 2015, the Company reevaluated the residual value used to calculate its depreciation of EIP and determined that a change in estimate was necessary. The change in estimate resulted in higher depreciation expense through the expiration of the lease in April 2015 of approximately $393 thousand per quarter.
Mowood, LLC
The Company provides a revolving line of credit to Mowood which allows for a maximum principal balance of $5.3 million. At November 30, 2012, the principal balance outstanding was $3.8 million. At December 31, 2013, the principal balance outstanding was $5.3 million. Omega's operating results for the year ended December 31, 2013 were as expected and on plan. In contrast, operating results for the comparable period in 2012 were approximately 15 percent higher than originally expected due to higher margins from several construction projects that were completed. Little to no impact is expected to Omega’s business plan as a result of any governmental spending cuts related to the Budget Control Act of 2011. While there could be a delay in receiving payment, the U.S. Government is ultimately expected to make payment in accordance with the terms of the contract, including the payment of interest, where applicable, under the Prompt Payment Act.
Private Security Assets
Following is a summary of the fair values of the other equity securities that we held at December 31, 2013 as they compare to the fair values at November 30, 2012.
|
| | | | | | | | | | | | | | | | | | | | | | | | | | |
Fair Value of Other Equity Securities |
Portfolio Company | | Fair Value at December 31, 2013 | | Fair Value at December 31, 2012 | | $ Change | | % Change | | Fair Value at November 30, 2012 | | $ Change | | % Change |
Lightfoot | | $ | 10,528,743 |
| | $ | 8,748,544 |
| | $ | 1,780,199 |
| | 20.35 | % | | $ | 8,669,366 |
| | $ | 79,178 |
| | 0.91 | % |
VantaCore | | $ | 12,775,578 |
| | $ | 10,958,582 |
| | $ | 1,816,996 |
| | 16.58 | % | | $ | 11,197,255 |
| | $ | (238,673 | ) | | (2.13 | )% |
Lightfoot Capital Partners LP and Lightfoot Capital Partners GP LLC
The fair value of Lightfoot as of December 31, 2013 increased $1.8 million, or 20.35 percent, as compared to the valuation at December 31, 2012, primarily due to the value of Arc Logistics publicly traded shares, post their Initial Public Offering, discounted for their lack of marketability to the Company and favorable changes in the discounted cash flow analysis valuing the Company's interest in Gulf LNG. During the one-month transition period ended December 31, 2012, the fair value of Lightfoot increased $79 thousand, or .91 percent, as compared to the valuation at November 30, 2012, primarily due to small market value changes in the MLP comparable companies. For its last three quarters, Arc had sufficient distributable cash flow to pay a distribution, but instead retained cash for capital expenditures and potential future acquisitions, including expenses in connection with their IPO. The Company received a partial fourth quarter dividend of approximately $176 thousand. Arc continues to concentrate a majority of its capital expenditures on projects that increase revenue and reduce operating expenses. Arc is also analyzing various strategic alternatives and acquisitions that would be expected to provide incremental earnings.
Based on the minimum quarterly distributions that Arc plans to make following its IPO as described in its IPO prospectus, and on discussions with Lightfoot’s management, the Company currently expects to receive distributions of approximately $900 thousand from Lightfoot during fiscal 2014, funded primarily by Lightfoot’s distributions from Arc. However, both the ability of Arc to make quarterly distributions and the amount of such distributions will be dependent on Arc’s business results, and neither Arc nor Lightfoot is under any obligation to make such distributions. Accordingly, there can be no assurance that our expectations concerning 2014 distributions from Lightfoot will be realized.
VantaCore Partners LP
The fair value of VantaCore as of December 31, 2013 increased $1.8 million, or approximately 16.6 percent, as compared to the fair value at December 31, 2012. The increase is attributable to two main changes from last year to this year. First, 2013 trailing twelve-months EBITDA included a full year's worth of Laurel Aggregates earnings. The increase in EBITDA for 2013 also compared more favorably with selected public companies, increasing the multiples used to value VantaCore's enterprise value. Second, VantaCore was able to pay down part of their debt in 2013. The fair value of VantaCore as of December 31, 2012 decreased $239 thousand, or approximately 2.1 percent, as compared to the fair value at November 30, 2012. The decrease is primarily due to small market value changes in the MLP comparable companies. VantaCore was again unable to meet its minimum quarterly distribution in cash for its quarter ended December 31, 2013. Therefore, the common and preferred unit holders elected to receive their distributions as a combination of $0.382 per unit in cash and the remainder in preferred units. The Company received approximately $471 thousand in cash and an additional 6,677 preferred units during the three-month period ended December 31, 2013.
Formerly Owned High Sierra Energy, LP and High Sierra Energy, GP (“High Sierra”)
On June 19, 2012, NGL Energy Partners, LP and certain of its affiliates (collectively “NGL”) acquired High Sierra. By March 31, 2013, the Company had liquidated all its NGL holdings. Upon receipt of the final 2012 K-1, tax expense related to the sale was recognized in the second quarter of 2013.
Formerly Owned International Resource Partners, LP
The escrow receivable due the Company as of November 30, 2012, which related to the sale of International Resource Partners, LP, was settled during the second quarter of 2013 upon satisfaction of certain post-closing obligations. The fair value of the escrow receivable reflected a discount for the potential that the full amount due to the Company would not be realized. The actual payment received in the amount of $1.0 million exceeded the balance recorded of $699 thousand, resulting in a second quarter gain of approximately $307 thousand.
CONTRACTUAL OBLIGATIONS
The following table summarizes our significant contractual payment obligations as of December 31, 2013.
|
| | | | | | | | | | | | | | | | | | | |
Contractual Obligations |
| Notional Value | | Less than 1 year | | 1-3 years | | 3-5 years | | More than 5 years |
Long-Term Debt | $ | 70,000,000 |
| | $ | 2,940,000 |
| | $ | 7,056,000 |
| | $ | 60,004,000 |
| | $ | — |
|
Interest payments on long-term debt | | | 2,387,296 |
| | 4,419,005 |
| | 2,023,138 |
| | — |
|
Totals | | | $ | 5,327,296 |
| | $ | 11,475,005 |
| | $ | 62,027,138 |
| | $ | — |
|
The Mowood Note Payable is not included in the above table because it relates to indebtedness under a line of credit with no fixed repayment schedule.
In December of 2012, Pinedale LP entered into a $70 million secured term credit facility with KeyBank to finance a portion of the acquisition of the Pinedale LGS. The primary term of the credit facility is three years, with an option for a one-year extension. Under the KeyBank credit facility, Pinedale LP is obligated to make monthly principal payments, which are to begin in the second year of the term, equal to 0.42 percent of the $70 million loan outstanding. Interest accrues at a variable annual rate equal to LIBOR plus 3.25 percent. For purposes of the above presentation, interest payments were calculated using the LIBOR rate in effect at December 31, 2013 (0.17 percent at December 31, 2013).
OFF-BALANCE SHEET ARRANGEMENTS
We do not have, and are not expected to have, any off-balance sheet arrangements that have or are reasonably likely to have a current or future effect on our financial condition, changes in financial condition, revenues or expenses, results of operations, liquidity, capital expenditures or capital resources.
MAJOR TENANTS
As of December 31, 2013, the Company had two significant leases. The table below displays the impact of each lease on total leased properties as of December 31, 2013 and total lease revenues for the year ended December 31, 2013 and the one-month transition period ended December 31, 2013.
|
| | | | | | |
| | Significant Leases as a Percentage of |
| | Leased Properties | | Lease Revenues |
| | As of December 31, 2013 | | For the Year Ended December 31, 2013 | | For the One-Month Transition Period December 31, 2012 |
Pinedale LGS | | 94.23% | | 88.68% | | 75.20% |
Public Service of New Mexico | | 5.77% | | 11.32% | | 24.80% |
Pinedale LGS. In December of 2012, the Company entered into a lease guaranteed by Ultra Petroleum, which is material to the Company. In view of the fact that Ultra Petroleum leases a substantial portion of the Company's net leased property which is a significant source of revenues and operating income, its financial condition and ability and willingness to satisfy its obligations under its lease with the Company, are expected to have a considerable impact on the results of operation going forward. As of December 31, 2013, approximately 94.2 percent of the Company's leased property, based on the gross book value of real estate investments, was leased to Ultra Petroleum. Approximately 88.68 percent of the Company's total lease revenue for the year ended December 31, 2013 was derived from Ultra Petroleum.
Ultra Petroleum leases a substantial portion of our net leased property, which is a significant source of revenues and operating income, and under the requirements of Exchange Act, we include Summary Consolidated Balance Sheets and Consolidated Statements of Operations for Ultra Petroleum in Note 4 in the Notes to the Consolidated Financial Statements of this report. Ultra Petroleum is currently subject to the reporting requirements of the Exchange Act and is required to file with the SEC annual reports containing audited financial statements and quarterly reports containing unaudited financial statements. The audited financial
statements and unaudited financial statements of Ultra Petroleum can be found on the SEC's website at www.sec.gov. We have not prepared the financial statements of Ultra Petroleum included in this report and, although we have no reason to believe they are not accurate in all material respects, we are not able to confirm the accuracy of the Ultra Petroleum financial statements. We cannot assure you that there has not been any material adverse changes since the date of the information included in this report.
EIP. The Company's investment in EIP is leased under net operating leases with various terms. As of December 31, 2013, approximately 5.77 percent of the Company's leased property, based on the gross book value of real estate investments, was leased to PNM. Approximately 11.32 percent of the Company's total revenue for the year ended December 31, 2013 was derived from PNM.
In view of the fact that the PNM lease is a significant source of revenues and operating income, its financial condition and ability and willingness to satisfy its obligations under its lease with the Company, have a considerable impact on the results of operation.
PNM is a subsidiary of PNM Resources Inc. ("PNM Resources"), which is currently subject to the reporting requirements of the Exchange Act and is required to file with the SEC annual reports containing audited financial statements and quarterly reports containing unaudited financial statements. The audited financial statements and unaudited financial statements of PNM Resources can be found on the SEC's website at www.sec.gov. The Company makes no representation as to the accuracy or completeness of the audited and unaudited financial statements of PNM Resources but has no reason not to believe the accuracy or completeness of such information. In addition, PNM Resources has no duty, contractual or otherwise, to advise the Company of any events that might have occurred subsequent to the date of such financial statements which could affect the significance or accuracy of such information. None of the information in the public reports of PNM Resources that are filed with the SEC is incorporated by reference into, or in any way, form part of this filing.
Portland Terminal Facility. In January 2014, the Company entered into a triple net lease with Arc Terminals for use of the Portland Terminal Facility, which is guaranteed by Arc Logistics. Arc Logistics has an equity market capitalization of approximately $269 million as of March 7, 2014, based on the number of common and subordinated units outstanding as of Arc Logistics’ annual report on Form 10-K filed with the SEC on March 14, 2014. Following the consummation of the Portland Transaction, the Portland Terminal Facility will account for approximately 14.6 percent of our total assets on a pro forma basis as of December 31, 2013, and the lease payments will account for approximately 14.5 percent of our total revenue on a pro forma basis for the year ended December 31, 2013.
DIVIDENDS
The following table sets forth distributions for the years ended December 31, 2013, November 30, 2012 and November 30, 2011. Distributions are shown in the period in which they were declared. A dividend relating to the fourth quarter of 2013 was declared and paid in January 2014.
|
| | | |
| Amount |
2013 | |
Fourth Quarter(1) | $ | — |
|
Third Quarter | $ | 0.1250 |
|
Second Quarter | $ | 0.1250 |
|
First Quarter | $ | 0.1250 |
|
| |
2012 | |
Fourth Quarter | $ | 0.1100 |
|
Third Quarter | $ | 0.1100 |
|
Second Quarter | $ | 0.1100 |
|
First Quarter | $ | 0.1100 |
|
| |
2011 | |
Fourth Quarter | $ | 0.1100 |
|
Third Quarter | $ | 0.1000 |
|
Second Quarter | $ | 0.1000 |
|
First Quarter | $ | 0.1000 |
|
| |
(1) | The 2013 fourth quarter dividend was paid in the first quarter of 2014. On January 3, 2014, our Board declared a dividend of $0.125 per share, payable January 23, 2014 to common stockholders of record as of January 13, 2014. |
Our portfolio of real property assets, promissory notes, and investment securities generate cash flow to us from which we pay distributions to stockholders. For our fiscal year ended December 31, 2013, the sources of our stockholder distributions were lease income from our real property assets and distributions from our investment securities. The amount of any distribution is recorded by the Company on the ex-dividend date.
The characterization of any distribution for federal income tax purposes will not be determined until after the end of the taxable year. Our Board of Directors has indicated that it intends to approve an increase in our quarterly distribution payable to stockholders from $.125 to $.13 per share. The $.13 per share distribution is expected to apply from the date after closing of the acquisition of the Portland Terminal Facility. There is no assurance that we will continue to make regular distributions.
During 2014, we intend to make publicly available standard performance measures utilized by REITs, including Funds from Operations (“FFO”) and Adjusted Funds from Operations (“AFFO”). A REIT is generally required to distribute during the taxable year an amount equal to at least 90 percent of the REIT taxable income (determined under Internal Revenue Code section 857(b)(2), without regard to the deduction for dividends paid). We intend to adhere to this requirement in order to qualify as a REIT. The Board of Directors will continue to determine the amount of any distribution that we expect to pay our stockholders.
IMPACT OF INFLATION AND DEFLATION
Deflation can result in a decline in general price levels, often caused by a decrease in the supply of money or credit. The predominant effects of deflation are high unemployment, credit contraction and weakened consumer demand. Restricted lending practices could impact our ability to obtain financings or to refinance our properties and our tenants' ability to obtain credit. During inflationary periods, we intend for substantially all of our tenant leases to be designed to mitigate the impact of inflation. Generally our leases include rent escalators that are based on the CPI, or other agreed upon metrics that increase with inflation.
LIQUIDITY AND CAPITAL RESOURCES
At year end, we had approximately $15 million, net of near-term obligations, available for future investment. There are opportunities that are in preliminary stages of review, and consummation of any of these opportunities depends on a number of factors beyond our control. There can be no assurance that any of these acquisition opportunities will result in consummated transactions. As part of our disciplined investment philosophy, we plan to use a moderate level of leverage, approximately 25 percent to 50 percent of assets. We may invest in assets subject to greater leverage, but which we would expect to be non-recourse to us.
Pinedale LP has a $70 million secured term credit facility with KeyBank that provides for monthly payments of principal and interest. Outstanding balances under the credit facility generally accrue interest at a variable annual rate equal to LIBOR plus 3.25 percent. The credit facility is secured by the Pinedale LGS. Pinedale LP is obligated to pay all accrued interest quarterly and is further obligated to pay monthly, beginning March 7, 2014, 0.42 percent of the amount outstanding on the loan on March 1, 2014.
In December of 2012 we executed interest rate swap derivatives covering $52.5 million of notional value, to add stability to our interest expense and to manage our exposure to interest rate movements on our LIBOR based borrowings. Interest rate swaps involve the receipt of variable-rate amounts from a counterparty in exchange for us making fixed-rate payments over the life of the agreements without exchange of the underlying notional amount.
Our registration statement covering a proposed maximum aggregate offering price of $300 million of securities was declared effective on June 8, 2012. The common equity offering closing on January 21, 2014 reduced the total available for sale pursuant to that registration statement by the gross proceeds of the offering and exercise of the underwriter's over-allotment option. The remaining availability is $161.7 million of maximum aggregate offering price of securities.
On May 8, 2013, the Company entered into a $20 million revolving line of credit with KeyBank. The primary term of the facility is three years with the option for a one-year extension. Outstanding balances under the revolving credit facility (the "Revolver") will accrue interest at a variable annual rate equal to LIBOR plus 4.0 percent or the Prime Rate plus 2.75 percent. We intend to use the facility to fund general working capital needs and if necessary, to provide short-term financing for the acquisition of additional real property assets. The amount available to be drawn under this facility is subject to a borrowing base limitation. If we were to use the Revolver to provide short-term financing for an acquisition, we would expect the assets acquired to be taken into consideration in determining the borrowing base. As of December 31, 2013 there had been no borrowings against the Revolver.
As of December 31, 2013 the securities in our portfolio only included illiquid securities issued by privately-held companies. During the three-month period ended March 31, 2013, we liquidated approximately $4.3 million of our remaining publicly traded securities, which generated cash of approximately $4.6 million. We reported the gains on the securities transactions as Other Income rather than Income from Operations.
On October 29, 2010, Mowood entered into a Note Payable Agreement (the "2010 Note Payable Agreement") with a financial institution with a maximum borrowing base of $1.3 million. The 2010 Note Payable Agreement was amended and restated on
October 29, 2011 and again amended and restated on October 29, 2012. Borrowings on the 2010 Note Payable Agreement were secured by all of Mowood's assets. Interest accrued at LIBOR, plus 4 percent, was payable monthly, with all outstanding principal and accrued interest payable on the termination date of October 29, 2013. As of September 30, 2013, there were no outstanding borrowings under this agreement.
On October 15, 2013, Mowood entered into a new Revolving Note Payable Agreement (“2013 Note Payable Agreement”), replacing the aforementioned 2010 Note Payable Agreement, which expired on October 29, 2013. The 2013 Note Payable Agreement has a maximum borrowing base of $1.5 million. Borrowings on the 2013 Note Payable Agreement are secured by Mowood’s assets. Interest accrues at Prime Lending Rate as published in the Wall Street Journal, plus 0.5 percent (3.75 percent at December 31, 2013), is payable monthly, with all outstanding principal and accrued interest payable on the termination date of October 15, 2014. The 2013 Note Payable Agreement contains various restrictive covenants, with the most significant relating to minimum consolidated fixed charge coverage ratio, the incidence of additional indebtedness, member distributions, extension of guaranties, future investments in other subsidiaries and change in ownership. Mowood was in compliance with the various covenants of the 2013 Note Payable Agreement as of December 31, 2013.
On November 30, 2011, the Company entered into a 180-day rolling evergreen Margin Loan Agreement with Bank of America, N.A. In December of 2012, the assets which secured this facility were sold, and as a result, this Margin Loan Agreement was terminated effective December 20, 2012.
We do not plan to make additional investments in securities (other than short-term, highly liquid investments to be held pending acquisition of real property assets) and intend to liquidate our remaining securities portfolio in an orderly manner.
ITEM 8. FINANCIAL STATEMENTS AND SUPPLEMENTARY DATA
Our financial statements and financial statement schedules are set forth beginning on page F-1 in this Annual Report and are incorporated herein by reference.
ITEM 9. CHANGES IN AND DISAGREEMENTS WITH ACCOUNTANTS ON ACCOUNTING AND FINANCIAL DISCLOSURE
None.
ITEM 9A. CONTROLS AND PROCEDURES
Our management is responsible for the preparation, consistency, integrity, and fair presentation of the financial statements. The financial statements have been prepared in accordance with U.S. generally accepted accounting principles applied on a consistent basis and, in management’s opinion, are fairly presented. The financial statements include amounts that are based on management’s informed judgments and best estimates.
Conclusion Regarding Effectiveness of Disclosure Controls and Procedures
Under the supervision and with the participation of our management, including our Chief Executive Officer and Chief Accounting Officer (our principal executive and principal financial officers, respectively), we have evaluated the effectiveness of our disclosure controls and procedures, as defined in Rule 13a-15(e) under the Securities Exchange Act of 1934, as amended, as of the end of the period covered by this report. Based on that evaluation, these officers concluded that our disclosure controls and procedures were effective to ensure that the information required to be disclosed by us in the reports that we file or submit under the Securities Exchange Act of 1934 is recorded, processed, summarized and reported within the time periods specified in the SEC rules and forms, and is accumulated and communicated to our management, including our Chief Executive Officer and Chief Accounting Officer, as appropriate, to allow timely decisions regarding required disclosure.
Management's Report on Internal Control over Financial Reporting
Our management is responsible for establishing and maintaining adequate internal control over financial reporting for the Company. Our management has established and maintains comprehensive systems of internal control designed to provide reasonable assurance as to the consistency, integrity, and reliability of the preparation and presentation of financial statements and the safeguarding of assets. The concept of reasonable assurance is based upon the recognition that the cost of the controls should not exceed the benefit derived. Our management monitors the systems of internal control and maintains an internal auditing program that assesses the effectiveness of internal control.
Our management assessed our systems of internal control over financial reporting for financial presentations in conformity with U.S. generally accepted accounting principles as of December 31, 2013. This assessment was based on criteria for effective internal control established in Internal Control—Integrated Framework issued by the Committee of Sponsoring Organizations of the
Treadway Commission (1992 framework) (the COSO Report). Based on this assessment, our management has determined that the Company’s internal control over financial reporting was effective as of December 31, 2013.
The Board of Directors exercises its oversight role with respect to the systems of internal control primarily through its Audit and Valuation Committee, which is comprised solely of independent outside directors. The Committee oversees systems of internal control and financial reporting to assess whether their quality, integrity, and objectivity are sufficient to protect shareholders’ investments.
There have been no changes in our internal control over financial reporting (as defined in Rules 13a-15(f) and 15d-15(f) of the Securities Exchange Act of 1934) during the fiscal quarter ended December 31, 2013, that have materially affected, or are reasonably likely to materially affect, our internal control over financial reporting.
Ernst & Young has issued an audit report on the Company’s internal control over financial reporting. This report begins on the next page.
Report of independent registered public accounting firm
The Board of Directors and Shareholders
CorEnergy Infrastructure Trust, Inc
We have audited CorEnergy Infrastructure Trust, Inc’s control over financial reporting as of December 31, 2013 based on criteria established in Internal Control—Integrated Framework issued by the Committee of Sponsoring Organizations of the Treadway Commission (1992 framework) (the COSO criteria). CorEnergy Infrastructure Trust, Inc’s management is responsible for maintaining effective internal control over financial reporting, and for its assessment of the effectiveness of internal control over financial reporting included in the accompanying Management’s Annual Report on Internal Control over Financial Reporting. Our responsibility is to express an opinion on the company’s internal control over financial reporting based on our audit.
We conducted our audit in accordance with the standards of the Public Company Accounting Oversight Board (United States). Those standards require that we plan and perform the audit to obtain reasonable assurance about whether effective internal control over financial reporting was maintained in all material respects. Our audit included obtaining an understanding of internal control over financial reporting, assessing the risk that a material weakness exists, testing and evaluating the design and operating effectiveness of internal control based on the assessed risk, and performing such other procedures as we considered necessary in the circumstances. We believe that our audit provides a reasonable basis for our opinion.
A company’s internal control over financial reporting is a process designed to provide reasonable assurance regarding the reliability of financial reporting and the preparation of financial statements for external purposes in accordance with generally accepted accounting principles. A company’s internal control over financial reporting includes those policies and procedures that (1) pertain to the maintenance of records that, in reasonable detail, accurately and fairly reflect the transactions and dispositions of the assets of the company; (2) provide reasonable assurance that transactions are recorded as necessary to permit preparation of financial statements in accordance with generally accepted accounting principles, and that receipts and expenditures of the company are being made only in accordance with authorizations of management and directors of the company; and (3) provide reasonable assurance regarding prevention or timely detection of unauthorized acquisition, use or disposition of the company’s assets that could have a material effect on the financial statements.
Because of its inherent limitations, internal control over financial reporting may not prevent or detect misstatements. Also, projections of any evaluation of effectiveness to future periods are subject to the risk that controls may become inadequate because of changes in conditions, or that the degree of compliance with the policies or procedures may deteriorate.
In our opinion, CorEnergy Infrastructure Trust, Inc maintained, in all material respects, effective internal control over financial reporting as of December 31, 2013, based on the COSO criteria.
We also have audited, in accordance with the standards of the Public Company Accounting Oversight Board (United States), the consolidated balance sheets of CorEnergy Infrastructure Trust, Inc (the Company) as of December 31, 2013 and 2012 and November 30, 2012 and the related consolidated statements of income, and cash flows for each of the years ended December 31, 2013 and, November 30, 2012 and 2011 and for the one-month transition period ended December 31, 2012 of CorEnergy Infrastructure Trust, Inc and our report dated March 17, 2014, expressed an unqualified opinion thereon.
/s/ Ernst & Young LLP
March 17, 2014
Kansas City, MO
ITEM 9B. OTHER INFORMATION
None.
PART III
ITEM 10. DIRECTORS, EXECUTIVE OFFICERS AND CORPORATE GOVERNANCE
Codes of Ethics
We have adopted a code of ethics, which applies to our principal executive officer and principal financial officer. We have also adopted a code of ethics that establishes procedures for personal investments and restricts certain personal securities transactions. Personnel subject to the code of ethics may invest in securities for their personal investment accounts, including securities that may be purchased or held by us, so long as such investments are made in accordance with the code of ethics. This information may be obtained, without charge, upon request by calling us at (816) 875-3705 or toll-free at (877) 699-2677 and on our Web site at http://corenergy.corridortrust.com.
You may also read and copy the codes of ethics at the Securities and Exchange Commission’s Public Reference Room in Washington, D.C. You may obtain information on the operation of the Public Reference Room by calling the Securities and Exchange Commission at (800) SEC-0330. In addition, the codes of ethics are available on the EDGAR Database on the Securities and Exchange Commission’s Internet site at http://www.sec.gov. You may obtain copies of the codes of ethics, after paying a duplicating fee, by electronic request at the following email address: publicinfo@sec.gov, or by writing the Securities and Exchange Commission’s Public Reference Section, Washington, D.C. 20549.
Sarbanes-Oxley Act of 2002
The Sarbanes-Oxley Act of 2002 (the “Sarbanes-Oxley Act”) imposes a wide variety of regulatory requirements on publicly-held companies and their insiders. The Sarbanes-Oxley Act requires us to review our policies and procedures to determine whether we comply with the Sarbanes-Oxley Act and the regulations promulgated thereunder. We will continue to monitor our compliance with all future regulations that are adopted under the Sarbanes-Oxley Act and will take actions necessary to ensure that we are in compliance therewith.
As of December 31, 2013, we are an accelerated filer. As an accelerated filer for the fiscal year ended December 31, 2013, we are required to prepare and include in our annual report to stockholders for such period a report regarding management’s assessment of our internal control over financial reporting under the Securities Exchange Act of 1934 (the “1934 Act”) and have included this report in Item 9A of this Annual Report on Form 10-K.
Additional information incorporated by reference to the sections captioned "Nominees for Directors," "Remaining Directors," "Information About Executive Officers," "Committees of the Board," "Section 16(a) Beneficial Ownership Reporting Compliance" and "Stockholder Proposals and Nominations for the 2015 Annual Meeting" in our proxy statement for our 2014 Annual Stockholder Meeting will be filed with the Securities and Exchange Commission within 120 days after the end of the fiscal year covered by this Annual Report.
ITEM 11. EXECUTIVE COMPENSATION
Incorporated by reference to the sections captioned "Director Compensation Table" and "Compensation Committee Interlocks and Insider Participation" in our proxy statement for our 2014 Annual Stockholder Meeting to be filed with the Securities and Exchange Commission within 120 days after the end of the fiscal year covered by this Annual Report.
ITEM 12. SECURITY OWNERSHIP OF CERTAIN BENEFICIAL OWNERS AND MANAGEMENT AND RELATED STOCKHOLDER MATTERS
Incorporated by reference to the sections captioned "Security Ownership of Management and Certain Beneficial Owners" and "Approval of Share Issuance Under Director Compensation Plan" in our proxy statement for our 2014 Annual Stockholder Meeting to be filed with the Securities and Exchange Commission within 120 days after the end of the fiscal year covered by this Annual Report.
ITEM 13. CERTAIN RELATIONSHIPS AND RELATED TRANSACTIONS, AND DIRECTOR INDEPENDENCE
Incorporated by reference to the sections captioned "Nominees for Director," "Remaining Directors," "Committees of the Board of Directors" and "Certain Relationships and Related Party Transactions" in our proxy statement for our 2014 Annual Stockholder
Meeting to be filed with the Securities and Exchange Commission within 120 days after the end of the fiscal year covered by this Annual Report.
ITEM 14. PRINCIPAL ACCOUNTING FEES AND SERVICES
Incorporated by reference to the section captioned "Independent Registered Public Accounting Firm Fees and Services" in our proxy statement for our 2014 Annual Stockholder Meeting to be filed with the Securities and Exchange Commission within 120 days after the end of the fiscal year covered by this Annual Report.
PART IV
ITEM 15. EXHIBITS AND FINANCIAL STATEMENT SCHEDULES
The following documents are filed as part of this Annual Report on Form 10-K:
1. The Financial Statements listed in the Index to Financial Statements on Page F-1.
2. The Exhibits listed in the Exhibit Index below.
|
| | |
| | |
Exhibit No. | | Description of Document |
| |
| | |
3.1 | | Articles of Amendment and Restatement of CorEnergy Infrastructure Trust, Inc. (2) |
| |
3.2 | | Second Amended and Restated Bylaws (3) |
| |
4.1 | | Form of Stock Certificate for Common Stock of CorEnergy Infrastructure Trust, Inc. (2) |
| |
4.2 | | Form of Warrant dated December 2006 (5) |
| |
4.3 | | Registration Rights Agreements with Merrill Lynch & Co; Merrill Lynch, Pierce, Fenner & Smith Incorporated, and Stifel, Nicolaus & Company, Incorporated dated January 9, 2006 (1) |
| |
4.4 | | Registration Rights Agreement dated April 2007 (5) |
| |
10.1 | | Dividend Reinvestment Plan (6) |
| |
10.2 | | Management Agreement dated August 7, 2013, effective July 1, 2013 (13) |
| |
10.3(a) | | Advisory Agreement dated December 1, 2011 (7) |
| |
10.3(b) | | Amended Advisory Agreement dated December 21, 2012 (11) |
| |
10.4 | | Custody Agreement with U.S. Bank National Association dated September 13, 2005 (1) |
| |
10.5 | | First Amendment to the Custody Agreement with U.S. Bank National Association dated May 24, 2010 (7) |
| |
10.6 | | Stock Transfer Agency Agreement with Computershare Investor Services, LLC dated September 13, 2005 (1) |
| |
10.7(a) | | Second Amended Administration Agreement dated December 1, 2011 (6) |
| |
10.7(b) | | Amendment and Assignment to the Second Amended Administration Agreement dated August 7, 2012 (11) |
| |
10.8 | | Warrant Agreement with Computershare Investor Services, LLC as Warrant Agent dated December 8, 2005 (1) |
| |
10.9(a) | | Purchase and Sale Agreement, dated December 7, 2012, by and between Ultra Wyoming, Inc. and Pinedale Corridor, LP (8) |
| |
10.9(b) | | Amendment to Purchase and Sale Agreement, dated December 13, 2012, by and between Ultra Wyoming, Inc. and Pinedale Corridor, LP (9) |
| | |
10.10(a) | | Subscription Agreement, dated December 7, 2012, by and among Pinedale GP, Inc., Ross Avenue Investments, LLC and Pinedale Corridor, LP (8) |
| |
10.10(b) | | First Amendment to Subscription Agreement by and among Pinedale Corridor, LP, Pinedale GP, Inc. and Ross Avenue Investments, LLC (9) |
| | |
10.11(a) | | Term Credit Agreement, dated December 7, 2012, by and among Pinedale Corridor, LP, KeyBank National Association, as lender and KeyBank National Association, as administrative agent (8) |
| |
|
| | |
| | |
| |
10.11(b) | | Amended and Restated Term Credit Agreement, dated December 14, 2012, by and among Pinedale Corridor, LP, KeyBank National Association, as lender and KeyBank National Association, as administrative agent (9) |
| |
10.12(a) | | Lease Agreement dated December 20, 2012 by and between Pinedale Corridor, LP and Ultra Wyoming LGS, LLC (10) |
| | |
10.12(b) | | First Amendment to Lease, dated June 19, 2013, by and between Pinedale Corridor, LP and Ultra Wyoming LGS, LLC (14) |
| |
10.13 | | First Amended and Restated Limited Partnership Agreement of Pinedale Corridor, LP by and between Pinedale GP, Inc. and Ross Avenue Investments, LLC (10) |
| | |
10.14(a) | | Revolving Credit Agreement dated as of May 8, 2013 by and among CorEnergy Infrastructure Trust, Inc., KeyBank National Association and the other financial institutions party to the Credit Agreement, as lenders and KeyBank National Association, as administrative agent (12) |
| | |
10.14(b) | | First Amendment to Revolving Credit Agreement, dated August 23, 2013, by and among CorEnergy Infrastructure Trust, Inc., KeyBank National Association and the other financial institutions party to the Credit Agreement, as lenders and KeyBank National Association, as administrative agent (14) |
| | |
10.16 | | Membership Interest Purchase Agreement, dated January 14, 2014, by and among Lightfoot Capital Partners, LP, CorEnergy Infrastructure Trust, Inc. and Arc Terminals Holdings LLC (15) |
10.17 | | Lease, dated January 21, 2014, by and between LCP Oregon Holdings, LLC and Arc Terminals Holdings LLC (16) |
10.18 | | Asset Purchase Agreement, dated January 21, 2014, by and between LCP Oregon Holdings, LLC and Arc Terminals Holdings LLC (16) |
| |
14.1 | | Code of Ethics for Principal Executive Officer and Principal Financial Officer (10) |
| |
21.1 | | Subsidiaries of the Company – filed herewith |
| | |
23.1 | | Consent of Ernst & Young LLP dated March 17, 2014 – filed herewith |
| |
31.1 | | Certification by Chief Executive Officer pursuant to Exchange Act Rule 13a-14(a), as adopted pursuant to Section 302 of the Sarbanes-Oxley Act of 2002 – filed herewith |
| |
31.2 | | Certification by Chief Accounting Officer pursuant to Exchange Act Rule 13a-14(a), as adopted pursuant to Section 302 of the Sarbanes-Oxley Act of 2002 – filed herewith |
| |
32.1 | | Certification by Chief Executive Officer and Chief Financial Officer pursuant to 18 U.S.C. Section 1350, as adopted pursuant to Section 906 of the Sarbanes-Oxley Act of 2002 – furnished herewith |
| |
101 | | The following materials from CorEnergy Infrastructure Trust, Inc.’s Annual Report on Form 10-K for the year ended November 30, 2012, formatted in XBRL (Extensible Business Reporting Language): (i) the Consolidated Balance Sheets, (ii) the Consolidated Statements of Operations, (iii) the Consolidated Statements of Cash Flows and (v) the Notes to Condensed Consolidated Financial Statements – furnished herewith |
| |
(1) | Incorporated by reference to the Registrant's Registration Statement on Form N-2, filed August 28, 2006 (File No. 333-136923). |
| |
(2) | Incorporated by reference to the Registrant's current report on Form 8-K, filed January 14, 2014 (the first Form 8-K filing on such date). |
| |
(3) | Incorporated by reference to the Registrant’s current report on Form 8-K, filed July 31, 2013. |
| |
(4) | Incorporated by reference to Pre-Effective Amendment No. 2 to the Registrant’s Registration Statement on Form N-2, filed January 9, 2007 (File No. 333-136923). |
| |
(5) | Incorporated by reference to Pre-Effective Amendment No. 1 to the Registrant’s Registration Statement on Form N-2, filed July 3, 2007 (File No. 333-142859). |
| |
(6) | Incorporated by reference to the Registrant’s Quarterly Report on Form 10-Q for the quarter ended August 31, 2007 and filed on October 12, 2007. |
Incorporated by reference to the Registrant’s Annual Report on Form 10-K, for the year ended November 30, 2010.
| |
(7) | Incorporated by reference to the Registrant’s current report on Form 8-K, filed December 1, 2011. |
| |
(8) | Incorporated by reference to the Registrant’s current report on Form 8-K, filed December 10, 2012. |
| |
(9) | Incorporated by reference to the Registrant’s current report on Form 8-K, filed December 17, 2012. |
| |
(10) | Incorporated by reference to the Registrant’s current report on Form 8-K, filed December 21, 2012. |
| |
(11) | Incorporated by reference to the Registrant's Annual Report on Form 10-K, for the year ended November 30, 2012, filed February 13, 2013. |
| |
(12) | Incorporated by reference to the Registrant's Quarterly Report on Form 10-Q for the quarter ended March 31, 2013, filed May 10, 2013. |
| |
(13) | Incorporated by reference to the Registrant's Quarterly Report on Form 10-Q for the quarter ended September 30, 2013, filed November 12, 2013. |
| |
(14) | Incorporated by reference to the Registrant's current report on Form 8-K, filed August 27, 2013. |
| |
(15) | Incorporated by reference to the Registrant's current report on Form 8-K, filed January 14, 2014 (the second Form 8-K filing on such date). |
| |
(16) | Incorporated by reference to the Registrant's current report on Form 8-K, filed January 22, 2014. |
All other exhibits for which provision is made in the applicable regulations of the Securities and Exchange Commission are not required under the related instruction or are inapplicable and therefore have been omitted.
INDEX TO FINANCIAL STATEMENTS
Report of Independent Registered Public Accounting Firm
The Board of Directors and Shareholders
CorEnergy Infrastructure Trust, Inc
We have audited the accompanying consolidated balance sheets of CorEnergy Infrastructure Trust, Inc ("the Company") as of December 31, 2013 and 2012 and November 30, 2012, and the related consolidated statements of income, shareholders’ equity, and cash flows for each of the years ended December 31, 2013, November 30, 2012 and November 30, 2011 and for the one-month transition period ended December 31, 2012. These financial statements are the responsibility of the Company’s management. Our responsibility is to express an opinion on these financial statements based on our audits.
We conducted our audits in accordance with the standards of the Public Company Accounting Oversight Board (United States). Those standards require that we plan and perform the audit to obtain reasonable assurance about whether the financial statements are free of material misstatement. An audit includes examining, on a test basis, evidence supporting the amounts and disclosures in the financial statements. An audit also includes assessing the accounting principles used and significant estimates made by management, as well as evaluating the overall financial statement presentation. We believe that our audits provide a reasonable basis for our opinion.
In our opinion, the financial statements referred to above present fairly, in all material respects, the consolidated financial position of CorEnergy Infrastructure Trust, Inc at December 31, 2013 and 2012 and November 30, 2012 and the consolidated results of its operations and its cash flows for the year ended December 31, 2013, and for each of the two years ended November 30, 2012 and 2011 and for the one-month transition period ended December 31, 2012 in conformity with U.S. generally accepted accounting principles.
We also have audited, in accordance with the standards of the Public Company Accounting Oversight Board (United States), CorEnergy Infrastructure Trust Inc’s internal control over financial reporting as of December 31, 2013, based on criteria established in Internal Control-Integrated Framework issued by the Committee of Sponsoring Organizations of the Treadway Commission (1992 framework) and our report dated March 17, 2014, expressed an unqualified opinion thereon.
/s/Ernst & Young LLP
March 17, 2014
Kansas City, MO
CorEnergy Infrastructure Trust, Inc. |
| | | | | | | | | | | |
CONSOLIDATED BALANCE SHEETS | December 31, 2013 | | November 30, 2012 | | December 31, 2012 |
Assets | | | | | |
Leased property, net of accumulated depreciation of $12,754,588, $1,131,680, and $1,607,624 at December 31, 2013, November 30, 2012, and December 31, 2012, respectively | $ | 232,220,618 |
| | $ | 12,995,169 |
| | $ | 243,078,709 |
|
Other equity securities, at fair value | 23,304,321 |
| | 19,866,621 |
| | 19,707,126 |
|
Cash and cash equivalents | 17,963,266 |
| | 14,333,456 |
| | 17,680,783 |
|
Trading securities, at fair value | — |
| | 55,219,411 |
| | 4,318,398 |
|
Property and equipment, net of accumulated depreciation of $2,037,685, $1,751,202, and $1,774,616 at December 31, 2013, November 30, 2012, and December 31, 2012, respectively | 3,318,483 |
| | 3,589,022 |
| | 3,566,030 |
|
Escrow receivable | — |
| | 698,729 |
| | 698,729 |
|
Accounts receivable | 2,068,193 |
| | 1,570,257 |
| | 922,894 |
|
Lease receivable | 711,229 |
| | — |
| | — |
|
Intangible lease asset, net of accumulated amortization of $729,847, $413,580, and $437,908 at December 31, 2013, November 30, 2012, and December 31, 2012 respectively | 364,924 |
| | 681,191 |
| | 656,863 |
|
Deferred debt issuance costs, net of accumulated amortization of $572,830, $0 and $16,350 at December 31, 2013, November 30, 2012, and December 31, 2012, respectively | 1,225,524 |
| | — |
| | 1,520,823 |
|
Deferred lease costs, net of accumulated amortization of $63,272, $0, and $1,967 at December 31, 2013, November 30, 2012, and December 31, 2012, respectively | 857,190 |
| | — |
| | 912,875 |
|
Hedged derivative asset | 680,968 |
| | — |
| | — |
|
Income tax receivable | 834,382 |
| | — |
| | — |
|
Prepaid expenses and other assets | 326,561 |
| | 2,477,977 |
| | 598,755 |
|
Total Assets | $ | 283,875,659 |
| | $ | 111,431,833 |
| | $ | 293,661,985 |
|
Liabilities and Equity | | | | | |
Long-term debt | $ | 70,000,000 |
| | $ | — |
| | $ | 70,000,000 |
|
Accounts payable and other accrued liabilities | 2,920,267 |
| | 2,885,631 |
| | 4,413,420 |
|
Lease obligation | — |
| | 27,522 |
| | 20,698 |
|
Income tax liability | — |
| | — |
| | 3,855,947 |
|
Deferred tax liability | 5,332,087 |
| | 7,172,133 |
| | 2,396,043 |
|
Line of credit | 81,935 |
| | 120,000 |
| | — |
|
Unearned revenue | — |
| | 2,370,762 |
| | 2,133,685 |
|
Total Liabilities | $ | 78,334,289 |
| | $ | 12,576,048 |
| | $ | 82,819,793 |
|
Equity | | | | | |
Warrants, no par value; 945,594 issued and outstanding at December 31, 2013, November 30, 2012, and December 31, 2012 (5,000,000 authorized) | $ | 1,370,700 |
| | $ | 1,370,700 |
| | $ | 1,370,700 |
|
Capital stock, non-convertible, $0.001 par value; 24,156,163 shares issued and outstanding at December 31, 2013, 9,190,667 shares issued and outstanding at November 30, 2012, and 24,140,667 shares issued and outstanding at December 31, 2012 (100,000,000 shares authorized) | 24,156 |
| | 9,191 |
| | 24,141 |
|
Additional paid-in capital | 173,441,019 |
| | 91,763,475 |
| | 175,256,675 |
|
Accumulated retained earnings | 1,580,062 |
| | 5,712,419 |
| | 4,209,023 |
|
Accumulated other comprehensive income | 777,403 |
| | — |
| | — |
|
Total CorEnergy Equity | 177,193,340 |
| | 98,855,785 |
| | 180,860,539 |
|
Non-controlling Interest | 28,348,030 |
| | — |
| | 29,981,653 |
|
Total Equity | 205,541,370 |
| | 98,855,785 |
| | 210,842,192 |
|
Total Liabilities and Equity | $ | 283,875,659 |
| | $ | 111,431,833 |
| | $ | 293,661,985 |
|
See accompanying Notes to Consolidated Financial Statements.
CorEnergy Infrastructure Trust, Inc.
CONSOLIDATED STATEMENTS OF INCOME AND COMPREHENSIVE INCOME |
| | | | | | | | | | | | | | | |
| For the Years Ended | | For the One-Month Transition Period Ended
December 31, 2012 |
| December 31, 2013 | | November 30, 2012 | | November 30, 2011 | |
Revenue | | | | | | | |
Lease revenue | $ | 22,552,976 |
| | $ | 2,552,975 |
| | $ | 1,063,740 |
| | $ | 857,909 |
|
Sales revenue | 8,733,044 |
| | 8,021,022 |
| | 2,161,723 |
| | 868,992 |
|
Total Revenue | 31,286,020 |
| | 10,573,997 |
| | 3,225,463 |
| | 1,726,901 |
|
Expenses | | | | | | | |
Cost of sales (excluding depreciation expense) | 6,734,665 |
| | 6,078,102 |
| | 1,689,374 |
| | 686,976 |
|
Management fees, net of expense reimbursements | 2,637,265 |
| | 1,046,796 |
| | 968,163 |
| | 155,242 |
|
Asset acquisition expenses | 806,083 |
| | 377,834 |
| | 638,185 |
| | 64,733 |
|
Professional fees | 1,678,137 |
| | 1,141,045 |
| | 548,759 |
| | 333,686 |
|
Depreciation expense | 11,429,980 |
| | 1,118,269 |
| | 364,254 |
| | 499,357 |
|
Amortization expense | 61,305 |
| | — |
| | — |
| | 1,967 |
|
Operating expenses | 924,571 |
| | 739,519 |
| | 196,775 |
| | 48,461 |
|
Directors’ fees | 178,196 |
| | 85,050 |
| | 70,192 |
| | 8,500 |
|
Other expenses | 580,183 |
| | 231,086 |
| | 183,674 |
| | 27,500 |
|
Total Expenses | 25,030,385 |
| | 10,817,701 |
| | 4,659,376 |
| | 1,826,422 |
|
Operating Income (Loss) | $ | 6,255,635 |
| | $ | (243,704 | ) | | $ | (1,433,913 | ) | | $ | (99,521 | ) |
Other Income (Expense) | | | | | | | |
Net distributions and dividend income | $ | 584,814 |
| | $ | (279,395 | ) | | $ | 651,673 |
| | $ | 2,325 |
|
Net realized and unrealized gain (loss) on trading securities | (251,213 | ) | | 4,009,933 |
| | 2,299,975 |
| | (1,769,058 | ) |
Net realized and unrealized gain (loss) on other equity securities | 5,617,766 |
| | 16,171,944 |
| | 2,283,773 |
| | (159,495 | ) |
Other Income | — |
| | — |
| | 40,000 |
| | — |
|
Interest expense | (3,288,378 | ) | | (81,123 | ) | | (36,508 | ) | | (416,137 | ) |
Total Other Income (Expense) | 2,662,989 |
| | 19,821,359 |
| | 5,238,913 |
| | (2,342,365 | ) |
Income (Loss) before income taxes | 8,918,624 |
| | 19,577,655 |
| | 3,805,000 |
| | (2,441,886 | ) |
Taxes | | | | | | | |
Current tax expense | 13,474 |
| | 29,265 |
| | 253,650 |
| | 3,855,947 |
|
Deferred tax expense (benefit) | 2,936,044 |
| | 7,199,669 |
| | 629,207 |
| | (4,776,090 | ) |
Income tax expense (benefit), net | 2,949,518 |
| | 7,228,934 |
| | 882,857 |
| | (920,143 | ) |
Net Income (Loss) | 5,969,106 |
| | 12,348,721 |
| | 2,922,143 |
| | (1,521,743 | ) |
Less: Net Income (Loss) attributable to non-controlling interest | 1,466,767 |
| | — |
| | — |
| | (18,347 | ) |
Net Income (Loss) attributable to CORR Stockholders | $ | 4,502,339 |
| | $ | 12,348,721 |
| | $ | 2,922,143 |
| | $ | (1,503,396 | ) |
| | | | | | | |
Net Income (Loss) | $ | 5,969,106 |
| | $ | 12,348,721 |
| | $ | 2,922,143 |
| | $ | (1,521,743 | ) |
Other comprehensive income: | | | | | | | |
Changes in fair value of qualifying hedges attributable to CORR Stockholders | 777,403 |
| | — |
| | — |
| | — |
|
Changes in fair value of qualifying hedges attributable to non-controlling interest | 181,762 |
| | — |
| | — |
| | — |
|
Net Change in Other Comprehensive Income | $ | 959,165 |
| | $ | — |
| | $ | — |
| | $ | — |
|
Total Comprehensive Income (Loss) | 6,928,271 |
| | 12,348,721 |
| | 2,922,143 |
| | (1,521,743 | ) |
Less: Comprehensive income attributable to non-controlling interest | 1,648,529 |
| | — |
| | — |
| | — |
|
Comprehensive Income (Loss) attributable to CORR Stockholders | $ | 5,279,742 |
| | $ | 12,348,721 |
| | $ | 2,922,143 |
| | $ | (1,521,743 | ) |
Earnings (Loss) Per Common Share: | | | | | | | |
Basic and Diluted | $ | 0.19 |
| | $ | 1.34 |
| | $ | 0.32 |
| | $ | (0.10 | ) |
Weighted Average Shares of Common Stock Outstanding: | | | | | | | |
Basic and Diluted | 24,149,396 |
| | 9,182,425 |
| | 9,159,809 |
| | 15,564,861 |
|
Dividends declared per share | $ | 0.375 |
| | $ | 0.440 |
| | $ | 0.410 |
| | $ | — |
|
See accompanying Notes to Consolidated Financial Statements.
CorEnergy Infrastructure Trust, Inc.
CONSOLIDATED STATEMENTS OF EQUITY
|
| | | | | | | | | | | | | | | | | | | | | | | | | | | | | | |
| Capital Stock | | | | Additional Paid-in Capital | | Accumulated Other Comprehensive Income | | Retained Earnings (Accumulated Deficit) | | Non-Controlling Interest | | Total |
| Shares | | Amount | | Warrants | | | | | |
Balance at November 30, 2010 | 9,146,506 |
| | $ | 9,147 |
| | $ | 1,370,700 |
| | $ | 98,444,952 |
| | $ | — |
| | $ | (4,345,626 | ) | | $ | — |
| | $ | 95,479,173 |
|
Net Income | — |
| | — |
| | — |
| | — |
| | — |
| | 2,922,143 |
| | — |
| | 2,922,143 |
|
Distributions to stockholders sourced as return of capital | — |
| | — |
| | — |
| | (3,755,607 | ) | | — |
| | — |
| | — |
| | (3,755,607 | ) |
Reinvestment of distributions to stockholders | 30,383 |
| | 30 |
| | — |
| | 252,212 |
| | — |
| | — |
| | — |
| | 252,242 |
|
Consolidation of wholly-owned subsidiary | — |
| | — |
| | — |
| | 741,181 |
| | — |
| | (5,212,819 | ) | | — |
| | (4,471,638 | ) |
Balance at November 30, 2011 | 9,176,889 |
| | 9,177 |
| | 1,370,700 |
| | 95,682,738 |
| | — |
| | (6,636,302 | ) | | — |
| | 90,426,313 |
|
Net Income | — |
| | — |
| | — |
| | — |
| | — |
| | 12,348,721 |
| | — |
| | 12,348,721 |
|
Distributions to stockholders sourced as return of capital | — |
| | — |
| | — |
| | (4,040,273 | ) | | — |
| | — |
| | — |
| | (4,040,273 | ) |
Reinvestment of distributions to stockholders | 13,778 |
| | 14 |
| | — |
| | 121,010 |
| | — |
| | — |
| | — |
| | 121,024 |
|
Balance at November 30, 2012 | 9,190,667 |
| | 9,191 |
| | 1,370,700 |
| | 91,763,475 |
| | — |
| | 5,712,419 |
| | — |
| | 98,855,785 |
|
Net Loss | — |
| | — |
| | — |
| | — |
| | — |
| | (1,503,396 | ) | | (18,347 | ) | | (1,521,743 | ) |
Net offering proceeds | 14,950,000 |
| | 14,950 |
| | — |
| | 83,493,200 |
| | — |
| | — |
| | — |
| | 83,508,150 |
|
Non-controlling interest contribution | — |
| | — |
| | — |
| | — |
| | — |
| | — |
| | 30,000,000 |
| | 30,000,000 |
|
Balance at December 31, 2012 | 24,140,667 |
| | 24,141 |
| | 1,370,700 |
| | 175,256,675 |
| | — |
| | 4,209,023 |
| | 29,981,653 |
| | 210,842,192 |
|
Net Income | — |
| | — |
| | — |
| | — |
| | — |
| | 4,502,339 |
| | 1,466,767 |
| | 5,969,106 |
|
Net change in cash flow hedges | — |
| | — |
| | — |
| | — |
| | 777,403 |
| | — |
| | 181,762 |
| | 959,165 |
|
Total comprehensive income | — |
| | — |
| | — |
| | — |
| | 777,403 |
| | 4,502,339 |
| | 1,648,529 |
| | 6,928,271 |
|
Dividends | — |
| | — |
| | — |
| | (1,923,760 | ) | | — |
| | (7,131,300 | ) | | — |
| | (9,055,060 | ) |
Distributions to Non-controlling interest | — |
| | — |
| | — |
| | — |
| | — |
| | — |
| | (3,282,152 | ) | | (3,282,152 | ) |
Reinvestment of dividends paid to stockholders | 15,496 |
| | 15 |
| | — |
| | 108,104 |
| | — |
| | — |
| | — |
| | 108,119 |
|
Balance at December 30, 2013 | 24,156,163 |
| | $ | 24,156 |
| | $ | 1,370,700 |
| | $ | 173,441,019 |
| | $ | 777,403 |
| | $ | 1,580,062 |
| | $ | 28,348,030 |
| | $ | 205,541,370 |
|
See accompanying Notes to Consolidated Financial Statements.
CorEnergy Infrastructure Trust, Inc.
CONSOLIDATED STATEMENTS OF CASH FLOWS |
| | | | | | | | | | | | | | | |
| For the Years Ended | | For the One-Month Transition Period Ended
December 31, 2012 |
| December 31, 2013 | | November 30, 2012 | | November 30, 2011 | |
Operating Activities | | | | | | | |
Net Income (Loss) | $ | 5,969,106 |
| | $ | 12,348,721 |
| | $ | 2,922,143 |
| | $ | (1,521,743 | ) |
Adjustments to reconcile net income (loss) to net cash provided by operating activities: | | | | | | | |
Distributions received from investment securities | (567,276 | ) | | 4,985,370 |
| | 2,845,434 |
| | — |
|
Deferred income tax, net | 2,936,044 |
| | 7,199,669 |
| | 629,207 |
| | (4,776,090 | ) |
Depreciation | 11,429,980 |
| | 1,118,269 |
| | 364,254 |
| | 499,357 |
|
Amortization | 909,724 |
| | 200,056 |
| | 27,030 |
| | 42,645 |
|
Realized and unrealized (gain) loss on trading securities | 251,213 |
| | (4,009,933 | ) | | (2,299,975 | ) | | 1,769,058 |
|
Realized and unrealized (gain) loss on other equity securities | (5,617,766 | ) | | (16,171,944 | ) | | (2,283,773 | ) | | 159,495 |
|
Unrealized (gain) loss on derivative contract | (11,095 | ) | | — |
| | — |
| | 316,756 |
|
Changes in assets and liabilities: | | | | | | | |
(Increase) decrease in accounts receivable | (1,145,299 | ) | | (167,302 | ) | | (49,695 | ) | | 647,363 |
|
(Increase) decrease in lease receivable | (711,229 | ) | | 474,152 |
| | 237,077 |
| | — |
|
(Increase) decrease in prepaid expenses and other assets | 272,194 |
| | (233,272 | ) | | 70,109 |
| | (177,521 | ) |
Increase in accounts payable and other accrued liabilities | 816,430 |
| | 1,533,944 |
| | 300,635 |
| | 122,445 |
|
Increase (decrease) in current income tax liability | (4,690,329 | ) | | — |
| | — |
| | 3,922,682 |
|
Increase (decrease) in unearned revenue | (2,133,685 | ) | | 2,370,762 |
| | — |
| | (237,077 | ) |
Net cash provided by operating activities | $ | 7,708,012 |
| | $ | 9,648,492 |
| | $ | 2,762,446 |
| | $ | 767,370 |
|
Investing Activities | | | | | | | |
Purchases of long-term investments of trading and other equity securities | — |
| | — |
| | (38,060,281 | ) | | — |
|
Proceeds from sale of long-term investment of trading and other equity securities | 5,580,985 |
| | 9,983,169 |
| | 53,950,583 |
| | 26,085,740 |
|
Deferred lease costs | (74,037 | ) | | — |
| | — |
| | (796,649 | ) |
Acquisition expenditures | (1,834,036 | ) | | (942,707 | ) | | — |
| | (205,706,823 | ) |
Purchases of property and equipment | (40,670 | ) | | (30,321 | ) | | — |
| | (421 | ) |
Cash paid in business combination | — |
| | — |
| | (12,250,000 | ) | | — |
|
Proceeds from sale of property and equipment | 5,201 |
| | 3,076 |
| | (1,045 | ) | | — |
|
Return of capital on distributions received | 1,772,776 |
| | — |
| | — |
| | — |
|
Net cash provided by (used in) investing activities | $ | 5,410,219 |
|
| $ | 9,013,217 |
| | $ | 3,639,257 |
| | $ | (180,418,153 | ) |
Financing Activities | | | | | | | |
Payments on lease obligation | (20,698 | ) | | (80,028 | ) | | (44,816 | ) | | (6,824 | ) |
Debt financing costs | (144,798 | ) | | (1,054,302 | ) | | — |
| | (1,391,846 | ) |
Net offering proceeds | (523,094 | ) | | — |
| | — |
| | 84,516,780 |
|
Debt issuance | — |
| | — |
| | — |
| | 70,000,000 |
|
Proceeds from non-controlling interest | — |
| | — |
| | — |
| | 30,000,000 |
|
Dividends paid | (8,946,941 | ) | | (3,919,249 | ) | | (3,503,365 | ) | | — |
|
Distributions to non-controlling interest | (3,282,152 | ) | | — |
| | — |
| | — |
|
Advances on revolving line of credit | 221,332 |
| | 5,285,000 |
| | — |
| | 530,000 |
|
Payments on revolving line of credit | (139,397 | ) | | (5,165,000 | ) | | (400,000 | ) | | (650,000 | ) |
Payments on long-term debt | — |
| | (2,188,000 | ) | | (1,221,000 | ) | | — |
|
Net cash used in financing activities | $ | (12,835,748 | ) | | $ | (7,121,579 | ) | | $ | (5,169,181 | ) | | $ | 182,998,110 |
|
Net Change in Cash and Cash Equivalents | $ | 282,483 |
| | $ | 11,540,130 |
| | $ | 1,232,522 |
| | $ | 3,347,327 |
|
Consolidation of wholly-owned subsidiary | — |
| | — |
| | 94,611 |
| | — |
|
Cash and Cash Equivalents at beginning of period | 17,680,783 |
| | 2,793,326 |
| | 1,466,193 |
| | 14,333,456 |
|
Cash and Cash Equivalents at end of period | $ | 17,963,266 |
| | $ | 14,333,456 |
| | $ | 2,793,326 |
| | $ | 17,680,783 |
|
Supplemental information continued on next page. | | | | | | | |
The previously reported cash flows from investing activities in the transition period statement of cash flows for the month ended December 31, 2012 included $49 million of proceeds from the sale of long-term securities and $230 million for the purchase of leased properties. These amounts have been reduced from the previously reported amounts to properly reflect the noncash transfer of NGL shares which had a value of approximately $23 million.
CorEnergy Infrastructure Trust, Inc.
CONSOLIDATED STATEMENTS OF CASH FLOWS
Continued from previous page.
|
| | | | | | | | | | | | | | | |
| For the Years Ended | | For the One-Month Transition Period Ended
December 31, 2012 |
| December 31, 2013 | | November 30, 2012 | | November 30, 2011 | |
Supplemental Disclosure of Cash Flow Information | | | | | | | |
Interest paid | $ | 2,651,355 |
| | $ | 203,611 |
| | $ | 176,595 |
| | $ | 2,765 |
|
Income taxes paid (net of refunds) | $ | 4,637,068 |
| | $ | 96,000 |
| | $ | 253,650 |
| | $ | — |
|
Non-Cash Investing Activities | | | | | | | |
Security proceeds from sale in long-term investment of other equity securities | $ | — |
| | $ | 26,565,400 |
| | $ | — |
| | $ | 23,046,215 |
|
Reclassification of prepaid expenses and other assets to deferred lease costs | $ | — |
| | $ | — |
| | $ | — |
| | $ | 753,940 |
|
Reclassification of prepaid expenses and other assets to acquisition expenditures | $ | — |
| | $ | — |
| | $ | — |
| | $ | 181,766 |
|
Change in accounts payable and accrued expenses related to deferred lease costs | $ | (68,417 | ) | | $ | — |
| | $ | — |
| | $ | (653,747 | ) |
Change in accounts payable and accrued expenses related to acquisition expenditures | $ | (1,545,163 | ) | | $ | — |
| | $ | — |
| | $ | 1,650,699 |
|
Non-Cash Financing Activities | | | | | | | |
Reclassification of prepaid expenses and other assets to issuance of equity | $ | — |
| | $ | — |
| | $ | — |
| | $ | 617,308 |
|
Reclassification of prepaid expenses and other assets to deferred loan costs | $ | — |
| | $ | — |
| | $ | — |
| | $ | 436,994 |
|
Change in accounts payable and accrued expenses related to the issuance of equity | $ | (523,094 | ) | | $ | — |
| | $ | — |
| | $ | 391,322 |
|
Change in accounts payable and accrued expenses related to debt financing costs | $ | 116,383 |
| | $ | — |
| | $ | — |
| | $ | (291,667 | ) |
Reinvestment of distributions by common stockholders in additional common shares | $ | 108,119 |
| | $ | 121,024 |
| | $ | 252,242 |
| | $ | — |
|
See accompanying Notes to Consolidated Financial Statements.
CorEnergy Infrastructure Trust, Inc.
NOTES TO CONSOLIDATED FINANCIAL STATEMENTS
December 31, 2013
1. INTRODUCTION AND BASIS OF PRESENTATION
Introduction
CorEnergy Infrastructure Trust, Inc. ("CorEnergy"), was organized as a Maryland corporation and commenced operations on December 8, 2005. Prior to December 3, 2012, our name was Tortoise Capital Resources Corporation. CorEnergy's shares are listed on the New York Stock Exchange under the symbol “CORR.” As used in this report, the terms "we", "us", "our" and the "Company" refer to CorEnergy and its subsidiaries.
Our assets are generally leased to energy companies via long-term triple net participating leases. The lease structure requires that the tenant pay all operating expenses of the business conducted by the tenant, including real estate taxes, insurance, utilities, and expenses of maintaining the asset in good working order.
Our long-term participating lease structures provide us base rents that are fixed and determinable, with escalators dependent upon increases in the Consumer Price Index. Leases may also include features that allow us to participate in the financial performance and/or value of the energy infrastructure asset.
The assets we own and seek to acquire include pipelines, storage tanks, transmission lines and gathering systems, among others. We intend to acquire assets that are accretive to our shareholders and allow us to become a diversified energy infrastructure real estate investment trust (REIT).
The Company's consolidated financial statements include the Company's direct or indirect wholly-owned subsidiaries. In connection with our decision to structure ourselves as a REIT in December 2012, we created taxable REIT subsidiaries to hold our remaining securities portfolio (Corridor Public Holdings, Inc. and its wholly-owned subsidiary Corridor Private Holdings, Inc.) and to hold our operating business (Mowood Corridor, Inc. and its wholly-owned subsidiary, Mowood, LLC ("Mowood"), which is the holding company for Omega Pipeline Company, LLC (“Omega”)). Omega owns and operates a natural gas distribution system in Fort Leonard Wood, Missouri. Omega is responsible for purchasing and coordinating delivery of natural gas to Fort Leonard Wood, as well as performing maintenance and expansion of the facilities. In addition, Omega provides gas marketing services to local commercial end users. Also consolidated as a wholly-owned subsidiary is Pinedale GP, Inc., owner of the general partner interest in the entity that owns the Pinedale LGS (see Note 3 for additional information). All significant intercompany balances and transactions have been eliminated in consolidation. The Company's financial statements also present minority interests in the case of entities that are not wholly-owned subsidiaries of the Company.
Consolidation of Mowood was initiated at the time the Company withdrew its election to be treated as a BDC (September 21, 2011) and began reporting its financial results in accordance with general corporate reporting guidelines instead of under the AICPA Investment Company Audit Guide (the “Guide”). At that time, the presentation of the Company’s financial statements changed.
The accompanying consolidated financial statements reflect the results of the Company’s operations for the period from December 1, 2010 to September 21, 2011, during which time the Company reported under the Guide, and therefore reported and accounted for Mowood as an investment carried at fair value. Subsequent to September 21, 2011, the Company ceased reporting under the Guide. The results of operations for Mowood for the years ended December 31, 2013, November 30, 2012, the one-month transition period ended December 31, 2012, and for the period from September 21, 2011 to November 30, 2011, and related balances at December 31, 2013, December 31, 2012 and November 30, 2012, are included in the Company’s consolidated financial statements as of and for the years ended December 31, 2013 and November 30, 2012 and as of and for the one-month transition period ended December 31, 2012.
Change in Fiscal Year End
On February 5, 2013, the Board of Directors of the Company approved a change in the Company's fiscal year end from November 30 to December 31. This change to the calendar year reporting cycle began January 1, 2013. As a result of the change, the Company reported a December 2012 fiscal month transition period, which was reported in the Quarterly Report on Form 10-Q for the calendar quarter ended March 31, 2013 and is included in this Annual Report on Form 10-K for the calendar year ending December 31, 2013.
Financial information for the years ended December 31, 2012 and 2011 has not been included in this Form 10-K for the following reasons: (i) the years ended November 30, 2012 and 2011 provide as meaningful a comparison to the year ended December 31,
2013 as would the years ended December 31, 2012 and 2011; (ii) there are no significant factors, seasonal or other, that would impact the comparability of information if the results for the years ended December 31, 2012 and 2011 were presented in lieu of results for the years ended November 30, 2012 and 2011; and (iii) it was not practicable or cost justified to prepare this information.
Basis of Presentation and Use of Estimates
The accompanying consolidated financial statements include our accounts and the accounts of our wholly owned subsidiaries and have been prepared in accordance with U.S. generally accepted accounting principles (“GAAP”) set forth in the Accounting Standards Codification (“ASC”), as published by the Financial Accounting Standards Board (“FASB”), and with the Securities and Exchange Commission (“SEC”) instructions to Form 10-K. The accompanying consolidated financial statements reflect all adjustments that are, in the opinion of management, necessary for a fair presentation of the Company's financial position, results of operations and cash flows for the periods presented. There were no adjustments that, in the opinion of management, were not of a normal and recurring nature. All intercompany transactions and balances have been eliminated in consolidation, and our net earnings are reduced by the portion of net earnings attributable to noncontrolling interests.
The financial statements included in this report are based on the selection and application of critical accounting policies, which require management to make significant estimates and assumptions. Critical accounting policies are those that are both important to the presentation of our financial condition and results of operations and require management's most difficult, complex or subjective judgments. Note 2 to the Consolidated Financial Statements, included in this report, further details information related to our significant accounting policies.
2. SIGNIFICANT ACCOUNTING POLICIES
A. Use of Estimates – The preparation of the consolidated financial statements in conformity with GAAP requires management to make estimates and assumptions that affect the reported amount of assets and liabilities, recognition of distribution income and disclosure of contingent assets and liabilities at the date of the consolidated financial statements. Actual results could differ from those estimates.
B. Leased Property – The Company includes assets subject to lease arrangements within Leased property, net of accumulated depreciation, in the Consolidated Balance Sheets. Lease payments received are reflected in lease revenue on the Consolidated Statements of Income, net of amortization of any off-market adjustments. Costs in connection with the creation and execution of a lease are capitalized and amortized over the lease term. See Note 4 for further discussion.
C. Cash and Cash Equivalents – The Company maintains cash balances at financial institutions in amounts that regularly exceed FDIC insured limits. The Company’s cash equivalents are comprised of short-term, liquid money market instruments.
D. Long-Lived Assets and Intangibles – Property and equipment are stated at cost less accumulated depreciation. Depreciation is computed using the straight-line method over the estimated useful life of the asset. Expenditures for repairs and maintenance are charged to operations as incurred, and improvements, which extend the useful lives of assets, are capitalized and depreciated over the remaining estimated useful life of the asset.
The Company initially records long-lived assets at their acquisition cost, unless the transaction is accounted for as a business combination. If the transaction is accounted for as a business combination, the Company allocates the purchase price to the acquired tangible and intangible assets and liabilities based on their estimated fair values. The Company determines the fair values of assets and liabilities based on discounted cash flow models using current market assumptions, appraisals, recent transactions involving similar assets or liabilities and/or other objective evidence, and depreciates the asset values over the estimated remaining useful lives.
The Company may acquire long-lived assets that are subject to an existing lease contract with the seller or other lessee party and the Company may assume outstanding debt of the seller as part of the consideration paid. If, at the time of acquisition, the existing lease or debt contract is not at current market terms, the Company will record an asset or liability at the time of acquisition representing the amount by which the fair value of the lease or debt contract differs from its contractual value. Such amount is then amortized over the remaining contract term as an adjustment to the related lease revenue or interest expense. The Company periodically reviews its long-lived assets, primarily real estate, for impairment whenever events or changes in circumstances indicate that the carrying amount of such assets may not be recoverable. The Company’s review involves comparing current and future operating performance of the assets, the most significant of which is undiscounted operating cash flows, to the carrying value of the assets. Based on this analysis, a provision for possible loss is recognized, if any. No impairment write-downs were recognized during the years ended December 31, 2013 and November 30, 2012 or during the one-month transition period ended December 31, 2012.
Costs in connection with the direct acquisition of a new asset are capitalized as a component of the purchase price and depreciated over the life of the asset. See Note 4 for further discussion.
E. Investment Securities – The Company’s investments in securities are classified as either trading or other equity securities:
| |
• | Trading securities – The Company’s publicly traded equity securities are classified as trading securities and are reported at fair value as of November 30, 2012 because the Company intended to sell these securities in order to acquire real asset investments. As of March 31, 2013, all trading securities had been sold. |
| |
• | Other equity securities – The Company’s other equity securities represent interests in private companies which the Company has elected to report at fair value under the fair value option. |
| |
• | Realized and unrealized gains and losses on trading securities and other equity securities – Changes in the fair values of the Company’s securities during the period reported and the gains or losses realized upon sale of securities during the period are reflected as other income or expense within the accompanying Consolidated Statements of Income. |
F. Security Transactions and Fair Value – Security transactions are accounted for on the date the securities are purchased or sold (trade date). Realized gains and losses are reported on an identified cost basis.
For equity securities that are freely tradable and listed on a securities exchange or over-the-counter market, the Company values those securities at their last sale price on that exchange or over-the-counter market on the valuation date. If the security is listed on more than one exchange, the Company will use the price from the exchange that it considers to be the principal, which may not necessarily represent the last sale price. If there has been no sale on such exchange or over-the-counter market on such day, the security will be valued at the mean between the last bid price and last ask price on such day.
The major components of net realized and unrealized gain or loss on trading securities for the years ended December 31, 2013, November 30, 2012 and November 30, 2011, and for the one-month transition period ended December 31, 2012, are as follows:
|
| | | | | | | | | | | | | | | | |
Major Components of Net Realized and Unrealized Gain (Loss) on Trading Securities |
| | For the Years Ended | | For the One-Month Transition Period Ended |
| | December 31,
2013 | | November 30,
2012 | | November 30,
2011 | | December 31,
2012 |
Net unrealized gain on trading securities | | $ | — |
| | $ | 3,985,269 |
| | $ | 238,617 |
| | $ | 4,663,211 |
|
Net realized gain (loss) on trading securities | | (251,213 | ) | | 24,664 |
| | 2,061,358 |
| | (6,432,269 | ) |
Total net realized and unrealized gain (loss) on trading securities | | $ | (251,213 | ) | | $ | 4,009,933 |
| | $ | 2,299,975 |
| | $ | (1,769,058 | ) |
The Company holds investments in illiquid securities including debt and equity securities of privately-held companies. These investments generally are subject to restrictions on resale, have no established trading market and are valued on a quarterly basis. Because of the inherent uncertainty of valuation, the fair values of such investments, which are determined in accordance with procedures approved by the Company’s Board of Directors, may differ materially from the values that would have been used had a ready market existed for the investments.
The Company determines fair value to be the price that would be received to sell an asset or paid to transfer a liability in an orderly transaction between market participants at the measurement date. The Company has determined the principal market, or the market in which the Company exits its private portfolio investments with the greatest volume and level of activity, to be the private secondary market. Typically, private companies are bought and sold based on multiples of EBITDA, cash flows, net income, revenues, or in limited cases, book value.
For private company investments, value is often realized through a liquidity event of the entire company. Therefore, the value of the company as a whole (enterprise value) at the reporting date often provides the best evidence of the value of the investment and is the initial step for valuing the Company’s privately issued securities. For any one company, enterprise value may best be expressed as a range of fair values, from which a single estimate of fair value will be derived. In determining the enterprise value of a portfolio company, an analysis is prepared consisting of traditional valuation methodologies including market and income approaches. The Company considers some or all of the traditional valuation methods based on the individual circumstances of the portfolio company in order to derive its estimate of enterprise value.
The fair value of investments in private portfolio companies is determined based on various factors, including enterprise value, observable market transactions, such as recent offers to purchase a company, recent transactions involving the purchase or sale of the equity securities of the company, or other liquidation events. The determined equity values may be discounted when the Company has a minority position, or is subject to restrictions on resale, has specific concerns about the receptivity of the capital markets to a specific company at a certain time, or other comparable factors exist.
The Company undertakes a multi-step valuation process each quarter in connection with determining the fair value of private investments. We have retained an independent valuation firm to provide third party valuation consulting services based on procedures that the Company has identified and may ask them to perform from time to time on all or a selection of private investments as determined by the Company. The multi-step valuation process is specific to the level of assurance that the Company requests from the independent valuation firm. For positive assurance, the process is as follows:
| |
• | The independent valuation firm prepares the valuations and the supporting analysis. |
| |
• | The Investment Committee of the Board of Directors reviews the valuations and supporting analysis, prior to approving the valuations. |
G. Accounts Receivable – Accounts receivable are presented at face value net of an allowance for doubtful accounts. Accounts are considered past due based on the terms of sale with the customers. The Company reviews accounts for collectibility based on an analysis of specific outstanding receivables, current economic conditions and past collection experience. At December 31, 2013, December 31, 2012 and November 30, 2012 management determined that an allowance for doubtful accounts related to our leases was not required. Lease payments by our tenants, as discussed within Note 4, have remained timely and without lapse.
H. Derivative Instruments and Hedging Activities - FASB ASC 815, Derivatives and Hedging (“ASC 815”), provides the disclosure requirements for derivatives and hedging activities with the intent to provide users of financial statements with an enhanced understanding of: (a) how and why an entity uses derivative instruments, (b) how the entity accounts for derivative instruments and related hedged items, and (c) how derivative instruments and related hedged items affect an entity's financial position, financial performance, and cash flows. Further, qualitative disclosures are required that explain the Company's objectives and strategies for using derivatives, as well as quantitative disclosures about the fair value of and gains and losses on derivative instruments, and disclosures about credit-risk-related contingent features in derivative instruments. Accordingly, the Company's derivative assets and liabilities are presented on a gross basis.
As required by ASC 815, the Company records all derivatives on the balance sheet at fair value. The accounting for changes in the fair value of derivatives depends on the intended use of the derivative, whether the Company has elected to designate a derivative in a hedging relationship and apply hedge accounting and whether the hedging relationship has satisfied the criteria necessary to apply hedge accounting. Derivatives designated and qualifying as a hedge of the exposure to changes in the fair value of an asset, liability, or firm commitment attributable to a particular risk, such as interest rate risk, are considered fair value hedges. Derivatives designated and qualifying as a hedge of the exposure to variability in expected future cash flows, or other types of forecasted transactions, are considered cash flow hedges. Derivatives may also be designated as hedges of the foreign currency exposure of a net investment in a foreign operation. Hedge accounting generally provides for the matching of the timing of gain or loss recognition on the hedging instrument with the recognition of the changes in the fair value of the hedged asset or liability that are attributable to the hedged risk in a fair value hedge or the earnings effect of the hedged forecasted transactions in a cash flow hedge. The Company may enter into derivative contracts that are intended to economically hedge certain of its risks, even though hedge accounting does not apply or the Company elects not to apply hedge accounting.
FASB ASC 820, Fair Value Measurements and Disclosure ("ASC 820"), defines fair value, establishes a framework for measuring fair value, and expands disclosures about fair value measurements. In accordance with ASC 820, the Company made an accounting policy election to measure the credit risk of its derivative financial instruments that are subject to master netting agreements on a net basis by counterparty portfolio.
I. Fair Value Measurements - Various inputs are used in determining the fair value of the Company’s assets and liabilities. These inputs are summarized in the three broad levels listed below:
| |
• | Level 1 – quoted prices in active markets for identical investments |
| |
• | Level 2 – other significant observable inputs (including quoted prices for similar investments, market corroborated inputs, etc.) |
| |
• | Level 3 – significant unobservable inputs (including the Company’s own assumptions in determining the fair value of investments) |
ASC 820 applies to reported balances that are required or permitted to be measured at fair value under existing accounting pronouncements; accordingly, the standard does not require any new fair value measurements of reported balances. ASC 820 emphasizes that fair value is a market-based measurement, not an entity-specific measurement. Therefore, a fair value measurement should be determined based on the assumptions that market participants would use in pricing the asset or liability. As a basis for considering market participant assumptions in fair value measurements, ASC 820 establishes a fair value hierarchy that distinguishes between market participant assumptions based on market data obtained from sources independent of the reporting entity (observable inputs that are classified within Levels 1 and 2 of the hierarchy) and the reporting entity's own assumptions about market participant assumptions (unobservable inputs classified within Level 3 of the hierarchy).
Level 1 inputs utilize quoted prices (unadjusted) in active markets for identical assets or liabilities that the Company has the ability to access. Level 2 inputs are inputs other than quoted prices included in Level 1 that are observable for the asset or liability, either directly or indirectly. Level 2 inputs may include quoted prices for similar assets and liabilities in active markets, as well as inputs that are observable for the asset or liability (other than quoted prices), such as interest rates, foreign exchange rates, and yield curves that are observable at commonly quoted intervals. Level 3 inputs are unobservable inputs for the asset or liability, which are typically based on an entity's own assumptions, as there is little, if any, related market activity. In instances where the determination of the fair value measurement is based on inputs from different levels of the fair value hierarchy, the level in the fair value hierarchy within which the entire fair value measurement falls is based on the lowest level input that is significant to the fair value measurement in its entirety. The Company's assessment of the significance of a particular input to the fair value measurement in its entirety requires judgment, and considers factors specific to the asset or liability.
The following section describes the valuation methodologies used by the Company for estimating fair value for financial instruments not recorded at fair value, but fair value is included for disclosure purposes only, as required under disclosure guidance related to the fair value of financial instruments.
| |
• | Cash and Cash Equivalents — The carrying value of cash, amounts due from banks, federal funds sold and securities purchased under resale agreements approximates fair value. |
| |
• | Escrow Receivable — The escrow receivable due the Company as of November 30, 2012, which relates to the sale of International Resource Partners, LP, was settled during the second quarter of 2013 upon satisfaction of certain post-closing obligations. The fair value of the escrow receivable reflected a discount for the potential that the full amount due to the Company would not be realized. The actual payment received in the amount of $1.006 million exceeded the balance recorded of $699 thousand, resulting in a gain of approximately $307 thousand. |
| |
• | Long-term Debt — The fair value of the Company’s long-term debt is calculated, for disclosure purposes, by discounting future debt service requirements by a rate equal to the Company’s current expected rate for an equivalent transaction. |
| |
• | Line of Credit — The carrying value of the line of credit approximates the fair value due to its short term nature. |
J. Revenue Recognition – Specific recognition policies for the Company’s revenue items are as follows:
| |
• | Lease Revenue – Income related to the Company’s leased property is recognized on a straight-line basis over the term of the lease when collectibility is reasonably assured. Rental payments on the Pinedale LGS leased property are typically received on a monthly basis. Prior to November 2012, rental payments on the EIP leased property were typically received on a semi-annual basis and were included as lease revenue within the accompanying Consolidated Statements of Income. Upon execution of the November 2012 Purchase Agreement related to the EIP leased property (the "Purchase Agreement"), rental payments received in advance are classified as unearned revenue and included in liabilities within the Consolidated Balance Sheets. Unearned revenue is amortized ratably over the lease period as revenue recognition criteria are met. Rental payments received in arrears are accrued and classified as Lease Receivable and included in assets within the Consolidated Balance Sheets. |
| |
• | Sales Revenue – Revenues related to natural gas distribution and performance of management services are recognized in accordance with GAAP upon delivery of natural gas and upon the substantial performance of management and supervision services related to the expansion of the natural gas distribution system. Omega, acting as a principal, provides for transportation services and natural gas supply for its customers on a firm basis. In addition, Omega is paid fees for the operation and maintenance of its natural gas distribution system, including any necessary expansion of the distribution system. Omega is responsible for the coordination, supervision and quality of the expansions while actual construction is generally performed by third party contractors. Revenues from expansion efforts are recognized in accordance with GAAP using either a completed contract or percentage of completion method based on the level and volume of estimates utilized, as well as the certainty or uncertainty of our ability to collect those revenues. |
K. Cost of Sales – Included in the Company’s cost of sales are the amounts paid for gas and propane, along with related transportation, which are delivered to customers, as well as the cost of material and labor related to the expansion of the natural gas distribution system.
L. Asset Acquisition Expenses – Costs in connection with the research of real property acquisitions not expected to be accounted for as business combinations are expensed as incurred until determination that the acquisition of the real property is probable. Upon such determination, costs in connection with the acquisition of the property are capitalized as described in paragraph (D) above.
M. Offering Costs – Offering costs related to the issuance of common stock are charged to additional paid-in capital when the stock is issued.
N. Debt Issuance Costs – Costs in connection with the issuance of new debt are capitalized and amortized over the debt term. See Note 11 for further discussion.
O. Distributions to Stockholders – The amount of any distributions to stockholders will be determined by the Board of Directors. Distributions to stockholders are recorded on the ex-dividend date.
P. Other Income Recognition – Specific policies for the Company’s other income items are as follows:
| |
• | Securities Transactions and Investment Income Recognition – Securities transactions are accounted for on the date the securities are purchased or sold (trade date). Realized gains and losses are reported on an identified cost basis. Distributions received from our equity investments are generally comprised of ordinary income, capital gains and distributions received from investment securities from the portfolio company. The Company records investment income and return of capital based on estimates made at the time such distributions are received. Such estimates are based on information available from each portfolio company and/or other industry sources. These estimates may subsequently be revised based on information received from the portfolio companies after their tax reporting periods are concluded, as the actual character of these distributions are not known until after our fiscal year end. |
| |
• | Subsequent to November 30, 2012, the Company reallocated the amount of 2012 income and return of capital it recognized for the period December 1, 2011 to November 30, 2012 based on the 2012 tax reporting information received from the individual portfolio companies. This reclassification amounted to an increase in net distributions and dividend income on securities of $567 thousand or $0.06 per share; a decrease in net realized and unrealized gains on trading and other equity securities of $567 thousand or $0.06 per share for the year ended November 30, 2012. |
| |
• | Dividends and distributions from investments – Dividends and distributions from investments are recorded on their ex-dates and are reflected as other income within the accompanying Consolidated Statements of Income. Distributions received from the Company’s investments are generally characterized as ordinary income, capital gains and distributions received from investment securities. The portion characterized as return of capital is paid by our investees from their cash flow from operations. The Company records investment income, capital gains and/or distributions received from investment securities based on estimates made at the time such distributions are received. Such estimates are based on information available from each company and/or other industry sources. These estimates may subsequently be revised based on information received from the entities after their tax reporting periods are concluded, as the actual character of these distributions is not known until after the fiscal year end of the Company. |
Q. Federal and State Income Taxation – We have elected to be treated as a REIT for federal income tax purposes (which we refer to as the “REIT Election”) for the calendar and tax year ended December 31, 2013. We determined that the Company satisfied the annual income test and the quarterly asset tests necessary for us to qualify and elect to be taxed as a REIT for 2013. Because certain of our assets may not produce REIT-qualifying income or be treated as interests in real property, during December 2012 we contributed those assets into wholly-owned Taxable REIT Subsidiaries ("TRSs"). This was done in 2012 in order to limit the potential that such assets and income would prevent us from qualifying as a REIT for 2013. Due to the REIT Election, we changed our fiscal year end from November 30 to December 31.
As to the year ended November 30, 2012 and one month period ended December 31, 2012, the Company is treated as a C corporation and is obligated to pay federal and state income tax on its taxable income. Currently, the highest regular marginal federal income tax rate for a corporation is 35 percent. The Company may be subject to a 20 percent federal alternative minimum tax on its federal alternative minimum taxable income to the extent that its alternative minimum tax exceeds its regular federal income tax. For years ended in 2012 and before, the distributions we made to our stockholders from our earnings and profits were treated as qualified dividend income ("QDI") and return of capital. QDI is taxed to our individual shareholders at the maximum rate for long-term capital gains, which through tax year 2012 was 15 percent and beginning in tax year 2013 will be 20 percent.
The Company's trading securities and other equity securities are limited partnerships or limited liability companies which are treated as partnerships for federal and state income tax purposes. As a limited partner, the Company reports its allocable share of taxable income in computing its own taxable income. The Company's tax expense or benefit is included in the Consolidated
Statements of Income based on the component of income or gains and losses to which such expense or benefit relates. Deferred income taxes reflect the net tax effects of temporary differences between the carrying amounts of assets and liabilities for financial reporting purposes and the amounts used for income tax purposes. A valuation allowance is recognized if, based on the weight of available evidence, it is more likely than not that some portion or all of the deferred income tax asset will not be realized. Due to our decision to structure ourselves as a REIT in December 2012, it is expected that for the year ended December 31, 2013 and future periods, any deferred tax liability or asset will be related entirely to the assets and activities of the Company's TRSs.
The Company has elected to be taxed as a REIT for 2013 rather than a C corporation and generally will not pay federal income tax on taxable income that is distributed to our stockholders. As a REIT, our distributions from earnings and profits will be treated as ordinary income and a return of capital, and generally will not qualify as QDI. To the extent that the REIT had accumulated C corporation earnings and profits from the periods prior to 2013, we have distributed such earnings and profits in 2013. A portion of our normal distribution was characterized for federal income tax purposes as a distribution of those earnings and profits from non-REIT years and have been treated as QDI.
As a REIT, the Company holds and operates certain of our assets through one or more wholly-owned TRSs. A TRS is a subsidiary of a REIT that is subject to applicable corporate income tax. Our use of TRSs enables us to continue to engage in certain businesses while complying with REIT qualification requirements and also allows us to retain income generated by these businesses for reinvestment without the requirement of distributing those earnings. In the future, we may elect to reorganize and transfer certain assets or operations from our TRSs to the Company or other subsidiaries, including qualified REIT subsidiaries.
If we cease to qualify as a REIT, the Company, as a C corporation, would be obligated to pay federal and state income tax on its taxable income. Currently, the highest regular marginal federal income tax rate for a corporation is 35 percent. The Company may be subject to a 20 percent federal alternative minimum tax on its federal alternative minimum taxable income to the extent that its alternative minimum tax exceeds its regular federal income tax.
R. Recent Accounting Pronouncements – In July 2013, the FASB issued ASU No. 2013-11 "Presentation of an Unrecognized Tax Benefit When a Net Operating Loss Carryforward, a Similar Tax Loss, or a Tax Credit Carryforward Exists". ASU No. 2013-11 amends FASB ASC Topic 740 Income taxes, to include explicit guidance on the financial statement presentation of an unrecognized tax benefit when a net operating loss carryforward, a similar tax loss, or a tax credit carryforward exists. ASU No. 2013-11 is effective for fiscal years, and interim periods within those years, beginning after December 15, 2013. Management is evaluating this amendment and does not expect adoption to have a material impact on the Company's consolidated financial statements.
In July 2013, the FASB issued ASU No. 2013-10 "Inclusion of the Fed Funds Effective Swap Rate (or Overnight Index Swap Rate) as a Benchmark Interest Rate for Hedge Accounting Purposes". ASU No. 2013-10 amends FASB ASC Topic 815 Derivatives and Hedging, to permit Fed Funds Effective Swap Rate (OIS) to be used as a U.S. benchmark interest rate for hedge accounting purposes under Topic 815, in addition to UST and LIBOR. The amendment also removes the restriction on using different benchmark rates for similar hedges. ASU No. 2013-10 is effective prospectively for qualifying new or redesignated hedging relationships entered into on or after July 17, 2013. The Company has adopted this amendment and it did not have a material impact on the Company's consolidated financial statements.
In June 2011, the FASB issued ASU No. 2011-05 "Presentation of Comprehensive Income". ASU No. 2011-05 amends FASB ASC Topic 220, Presentation of Comprehensive Income, to improve the comparability, consistency and transparency of financial reporting and to increase the prominence of items reported in other comprehensive income. ASU No. 2011-05 is effective for fiscal years beginning after December 15, 2011 and for interim periods within those fiscal years. The Company has adopted this amendment and has elected to present a single continuous statement of comprehensive income.
In December 2011, the FASB issued ASU No. 2011-12 "Deferral of the Effective Date for Amendments to the Presentation of Reclassifications of Items out of Accumulated Other Comprehensive Income in Accounting Standards Update No. 2011-05". ASU No. 2011-12 amends FASB ASC Topic 220, Presentation of Comprehensive Income, to defer only those changes in Update 2011-05 that relate to the presentation of reclassification adjustments. ASU No. 2011-12 is effective for fiscal years beginning after December 15, 2011 and for interim periods within those fiscal years. The adoption of this amendment did not have a material impact on the Company's consolidated financial statements.
In February 2013, the FASB issued ASU No. 2013-02 "Reporting of Amounts Reclassified Out of Accumulated Other Comprehensive Income". ASU No. 2013-02 amends FASB ASC Topic 220, Presentation of Comprehensive Income, to improve the reporting of reclassifications out of accumulated other comprehensive income. ASU No. 2013-02 is effective prospectively for reporting periods beginning after December 15, 2012. Management has adopted this amendment and this did not have a material impact on the Company's consolidated financial statements.
In December 2011, the FASB issued ASU No. 2011-11 "Disclosure about Offsetting Assets and Liabilities". ASU No. 2011-11 amends FASB ASC Topic 210, Balance Sheet, to improve the comparability, consistency and transparency of financial reporting and to increase the prominence of items reported in other comprehensive income. ASU No. 2011-11 is effective for fiscal years beginning after January 1, 2013 and for interim periods within those fiscal years. In January 2013, the FASB issued ASU No. 2013-01 "Clarifying the Scope of Disclosures about Offsetting Assets and Liabilities". ASU No. 2013-01 amends FASB ASC Topic 210, Balance Sheet, to address implementation issues about the scope of ASU No. 2011-11. The amendment, which clarifies the scope of Update 2011-11, applies to derivatives accounted for in accordance with FASB ASC Topic 815, Derivatives and Hedging, including bifurcated embedded derivatives, repurchase agreements and reverse repurchase agreements, and securities borrowing and securities lending transactions that are either offset in accordance with Section 210-20-45 or Section 815-10-45 or are subject to an enforceable master netting arrangement or similar agreement. ASU No. 2013-01 is effective for fiscal years beginning on or after January 1, 2013, and interim periods within those annual periods. The adoption of these amendments did not have a material impact on the Company's consolidated financial statements.
In January 2010, the FASB issued ASU No. 2010-06 "Improving Disclosures about Fair Value Measurements". ASU No. 2010-06 amends FASB ASC Topic 820, Fair Value Measurements and Disclosures, to require new disclosures for transfers in and out of Levels 1 and 2 and activity in Level 3 fair value measurements. and to clarify existing disclosures. ASU No. 2010-06 is effective for fiscal years beginning after December 15, 2010, and for interim periods within those fiscal years. Management has adopted this amendment and this did not have a material impact on the Company's consolidated financial statements.
3. LEASED PROPERTIES
Pinedale LGS
On December 20, 2012, our subsidiary, Pinedale Corridor, LP ("Pinedale LP"), closed on a Purchase and Sale Agreement with an indirect wholly-owned subsidiary of Ultra Petroleum Corp. ("Ultra Petroleum"). Pinedale LP acquired a system of gathering, storage, and pipeline facilities (the "Liquids Gathering System" or "Pinedale LGS"), with associated real property rights in the Pinedale Anticline in Wyoming for $205 million in cash and certain investment securities having an approximate market value of $23 million. The asset purchase price was funded in part by the issuance of 13 million shares of common stock with net proceeds of $73.6 million after the underwriters discount.
Physical Assets
Construction of the Pinedale LGS was completed by Ultra Petroleum in 2010. It consists of more than 150 miles of pipelines with 107 receipt points and four above-ground central gathering facilities. The system is used by Ultra Petroleum as a method of separating water, condensate and associated flash gas from a unified stream and subsequently selling or treating and disposing of the separated products. Prior to entering the Pinedale LGS, a commingled hydrocarbon stream is separated into wellhead natural gas and a liquids stream. The wellhead natural gas is transported to market by a third party. The remaining liquids, primarily water, are transported by the Pinedale LGS to one of its four central gathering facilities where they pass through a three-phase separator which separates condensate, water and associated natural gas. Condensate is a valuable hydrocarbon commodity that is sold by Ultra Petroleum; water is transported to disposal wells or a treatment facility for re-use; and the natural gas is sold or otherwise used by Ultra Petroleum for fueling on-site operational equipment. To date, no major operational issues have been reported with respect to the Pinedale LGS.
The asset is depreciated for book purposes over an estimated useful life of 26 years. The amount of depreciation recognized for the leased property for the years ended December 31, 2013, November 30, 2012 and 2011, and for the one-month transition period ended December 31, 2012 was $8.9 million, $0, $0, and $286 thousand, respectively.
See Note 4 for further information regarding the Pinedale Lease Agreement.
Non-Controlling Interest Partner
Prudential Financial, Inc. ("Prudential") funded a portion of the acquisition of the Pinedale LGS by investing $30 million in cash in Pinedale LP. Pinedale GP, a wholly-owned subsidiary of CorEnergy, funded a portion of the acquisition by contributing to Pinedale LP approximately $108.3 million in cash and certain equity securities valued at $20 million. Those investments were made on December 20, 2012. As a limited partner, Prudential holds 18.95 percent of the economic interest in Pinedale LP, while the general partner, Pinedale GP, holds the remaining 81.05 percent of the economic interest.
Debt
On December 20, 2012, Pinedale LP borrowed $70 million pursuant to a secured term credit facility with KeyBank National Association ("KeyBank") serving as a lender and the administrative agent on behalf of other lenders participating in the credit facility. The credit facility will remain in effect through December 2015, with an option to extend through December 2016. The credit facility is secured by the Pinedale LGS. See Note 11 for further information regarding the credit facility.
Eastern Interconnect Project (EIP)
Physical Assets
The EIP transmission assets are utilized by the lessee to move electricity across New Mexico between Albuquerque and Clovis. The physical assets include 216 miles of 345 kilovolt transmission lines, towers, easement rights, converters and other grid support components. Originally, the assets were depreciated for book purposes over an estimated useful life of 20 years. Pursuant to the Purchase Agreement discussed in Note 4, the Company reevaluated the residual value used to calculate its depreciation of the EIP, and determined that a change in estimate was necessary. The change in estimate resulted in higher depreciation expenses beginning in November of 2012 through the expiration of the lease in April 2015.
The amount of depreciation expense related to the EIP leased property for the years ended December 31, 2013 and November 30, 2012 and 2011 and for the one-month transition period ended December 31, 2012 was $2.3 million, $837 thousand, $294 thousand and $190 thousand, respectively. The December 31, 2013 and December 31, 2012 amounts include one year and one month of incremental depreciation of approximately $1.6 million and $131 thousand, respectively.
See Note 4 for further information regarding the PNM Lease Agreement (as defined therein).
Debt
The Company assumed a note with an outstanding principal balance of $3.4 million. The debt was collateralized by the EIP transmission assets. The note, which accrued interest at an annual rate of 10.25 percent, and had principal and interest payments due on a semi-annual basis, was paid in full on October 1, 2012.
4. LEASES
As of December 31, 2013 the Company had two significant leases. The table below displays the impact of each lease on total leased properties and total lease revenues for the periods presented. As of November 30, 2012, the Company's only lease was with the Public Service Company of New Mexico, which therefore comprised 100 percent of the Company's leased properties and lease revenues.
|
| | | | | | |
| | As a Percentage of |
| | Leased Properties | | Lease Revenues |
| | As of December 31, 2013 | | For the Year Ended December 31, 2013 | | For the One-Month Transition Period December 31, 2012 |
Pinedale LGS | | 94.23% | | 88.68% | | 75.20% |
Public Service of New Mexico | | 5.77% | | 11.32% | | 24.80% |
Pinedale LGS
Pinedale LP entered into a long-term triple net Lease Agreement on December 20, 2012, relating to the use of the Pinedale LGS (the “Pinedale Lease Agreement”) with Ultra Wyoming LGS, LLC (“Ultra Wyoming”), another indirect wholly-owned subsidiary of Ultra Petroleum. Ultra Wyoming utilizes the Pinedale LGS to gather and transport a commingled stream of oil, natural gas and water, then further utilizes the Pinedale LGS to separate this stream into its separate components. Ultra Wyoming's obligations under the Pinedale Lease Agreement are guaranteed by Ultra Petroleum and Ultra Petroleum's operating subsidiary, Ultra Resources, Inc. (“Ultra Resources”), pursuant to the terms of a related parent guaranty. Annual rent for the initial term under the Pinedale Lease Agreement is a minimum of $20 million (as adjusted annually for changes based on the Consumer Price Index (“CPI”), subject to annual maximum adjustments of 2 percent), with the exact rental amount determined by the actual volume of the components handled by the Pinedale LGS, subject to Pinedale LP not being in default under the Pinedale Lease Agreement. Total annual rent may not exceed $27.5 million.
As of December 31, 2013, November 30, 2012 and December 31, 2012, approximately $857 thousand, $0, and $913 thousand, respectively, of net deferred lease costs are included in the accompanying Consolidated Balance Sheets. The deferred costs are
amortized over the 15 year life of the Pinedale LGS lease. For the years ended December 31, 2013, November 30, 2012 and 2011, and the one-month transition period ended December 31, 2012, $61 thousand, $0, $0, and $2 thousand, respectively, is included in amortization expense within the Consolidated Statements of Income. Approximately $2.6 million in gross asset acquisition costs related to the Pinedale LGS acquisition is included in Leased Property within the Consolidated Balance Sheets. The asset acquisition costs will be depreciated over the anticipated 26 year life of the newly acquired asset and will be included in depreciation expense within the Consolidated Statements of Income.
The assets which comprise the Pinedale LGS include real property and land rights to which the purchase consideration was allocated based on relative fair values and equaled $122.3 million and $105.7 million, respectively. The land rights are being depreciated over the 26 year life of the related land lease with associated depreciation expense expected to be approximately $4.1 million for each of the next five years.
In view of the fact that Ultra Petroleum leases a substantial portion of the Company's net leased property, which is a significant source of revenues and operating income, its financial condition and ability and willingness to satisfy its obligations under its lease with the Company are expected to have a considerable impact on the results of operation going forward.
Ultra Petroleum is currently subject to the reporting requirements of the Securities Exchange Act of 1934, as amended (the "Exchange Act") and is required to file with the SEC annual reports containing audited financial statements and quarterly reports containing unaudited financial statements. The audited financial statements and unaudited financial statements of Ultra Petroleum can be found on the SEC's website at www.sec.gov. The Company makes no representation as to the accuracy or completeness of the audited and unaudited financial statements of Ultra Petroleum, but has no reason not to believe the accuracy or completeness of such information. In addition, Ultra Petroleum has no duty, contractual or otherwise, to advise the Company of any events that might have occurred subsequent to the date of such financial statements which could affect the significance or accuracy of such information. Summary Consolidated Balance Sheets and Consolidated Statements of Operations for Ultra Petroleum are provided below.
|
| | | | | | | |
Ultra Petroleum Corp. Summary Consolidated Balance Sheets (in thousands) |
| December 31, 2013 | | December 31, 2012 |
| |
Current assets | $ | 128,631 |
| | $ | 125,848 |
|
Non-current assets | 2,656,688 |
| | 1,881,497 |
|
Total Assets | $ | 2,785,319 |
| | $ | 2,007,345 |
|
| | | |
Current liabilities | 407,476 |
| | 514,092 |
|
Non-current liabilities | 2,709,333 |
| | 2,071,120 |
|
Total Liabilities | $ | 3,116,809 |
| | $ | 2,585,212 |
|
| | | |
Shareholder's (deficit) | (331,490 | ) | | (577,867 | ) |
Total Liabilities and Shareholder's Equity | $ | 2,785,319 |
| | $ | 2,007,345 |
|
| | | |
|
| | | | | | | |
Ultra Petroleum Corp. Summary Consolidated Statements of Operations (in thousands) |
| For the Years Ended December 31, |
| 2013 | | 2012 |
Revenues | $ | 933,404 |
| | $ | 809,974 |
|
Expenses | 561,138 |
| | 3,655,252 |
|
Operating Income (Loss) | 372,266 |
| | (2,845,278 | ) |
Other Income (Expense), net | (138,044 | ) | | (31,833 | ) |
Income (Loss) before income tax provision (benefit) | 234,222 |
| | (2,877,111 | ) |
Income tax provision (benefit) | (3,616 | ) | | (700,213 | ) |
Net Income (Loss) | $ | 237,838 |
| | $ | (2,176,898 | ) |
Public Service Company of New Mexico ("PNM")
EIP is leased on a triple net basis through April 1, 2015 (the "PNM Lease Agreement") to PNM, an independent electric utility company serving approximately 500 thousand customers in New Mexico. PNM is a subsidiary of PNM Resources Inc. (NYSE: PNM) ("PNM Resources"). Per the PNM Lease Agreement, at the time of expiration of the PNM Lease Agreement, the Company could choose to renew the PNM Lease Agreement with the lessee, the lessee could offer to repurchase the EIP, or the PNM Lease Agreement could be allowed to expire and the Company could find another lessee. Under the terms of the PNM Lease Agreement, the Company was to receive semi-annual lease payments.
At the time of acquisition, the rate of the PNM Lease Agreement was determined to be above market rates for similar leased assets and the Company recorded an intangible asset of $1.1 million for this premium which is being amortized as a reduction to lease revenue over the remaining lease term. See Note 10 below for further information as to the intangible asset.
On November 1, 2012 the Company entered into a definitive Purchase Agreement with PNM to sell the Company’s 40 percent undivided interest in the EIP upon termination of the PNM Lease Agreement on April 1, 2015 for $7.68 million. Upon execution of the Agreement, the schedule of the lease payments under the PNM Lease Agreement was changed so PNM's remaining basic lease payments due to the Company were accelerated. The semi-annual payments of approximately $1.4 million that were originally scheduled to be paid on April 1, and October 1, 2013, respectively, were received by the Company on November 1, 2012. Therefore, as of November 30, 2012, PNM had paid $2.4 million in future minimum lease payments in advance. The amount is reported as an unearned revenue liability within the Consolidated Balance Sheets. As of December 31, 2013 there were no remaining advance payments included in unearned revenue. The three remaining lease payments due April 1, 2014, October 1, 2014 and April 1, 2015 were paid in full on January 2, 2014, in accordance with the purchase agreement with PNM.
In conjunction with the November 1, 2012 Purchase Agreement, the Company reevaluated the residual value used to calculate its depreciation of the EIP, and determined that a change in estimate was necessary. The change in estimate resulted in higher depreciation expenses beginning in November of 2012 through the expiration of the lease in April 2015. The incremental depreciation amounts to approximately $1.6 million per year.
In view of the fact that the PNM Lease Agreement is a significant source of revenue and operating income, its financial condition and ability and willingness to satisfy its obligations under its lease with the Company have a considerable impact on the results of operations.
PNM Resources is currently subject to the reporting requirements of the Exchange Act and is required to file with the SEC annual reports containing audited financial statements and quarterly reports containing unaudited financial statements. The audited financial statements and unaudited financial statements of PNM Resources can be found on the SEC's web site at www.sec.gov. The Company makes no representation as to the accuracy or completeness of the audited and unaudited financial statements of PNM Resources but has no reason not to believe the accuracy or completeness of such information. In addition, PNM Resources has no duty, contractual or otherwise, to advise the Company of any events that might have occurred subsequent to the date of such financial statements which could affect the significance or accuracy of such information. None of the information in the public reports of PNM Resources that are filed with the SEC is incorporated by reference into, or in any way, form a part of this filing.
Future Minimum Lease Receipts
The future contracted minimum rental receipts for all net leases as of December 31, 2013 are as follows:
|
| | | | |
Future Minimum Lease Receipts |
Years Ending December 31, | | Amount |
2014 | | $ | 24,573,005 |
|
2015 | | 20,000,000 |
|
2016 | | 20,000,000 |
|
2017 | | 20,000,000 |
|
2018 | | 20,000,000 |
|
Thereafter | | 180,000,000 |
|
Total | | $ | 284,573,005 |
|
5. INCOME TAXES
Deferred income taxes reflect the net tax effect of temporary differences between the carrying amount of assets and liabilities for financial reporting and tax purposes. Components of the Company’s deferred tax assets and liabilities as of December 31, 2013, November 30, 2012 and December 31, 2012 are as follows:
|
| | | | | | | | | | | | |
Deferred Tax Assets and Liabilities |
| | December 31, 2013 | | November 30, 2012 | | December 31, 2012 |
Deferred Tax Assets: | | | | | |
|
Organization costs | | $ | — |
| | $ | (17,668 | ) | | $ | (27,188 | ) |
Net operating loss carryforwards | | (65,248 | ) | | (6,411,230 | ) | | — |
|
Net unrealized loss on investment securities | | — |
| | — |
| | (143,822 | ) |
Cost recovery of leased and fixed assets | | (966,914 | ) | | (36,443 | ) | | — |
|
Asset acquisition costs | | — |
| | (134,415 | ) | | (158,535 | ) |
AMT and State of Kansas credit | | — |
| | (196,197 | ) | | — |
|
Sub-total | | $ | (1,032,162 | ) | | $ | (6,795,953 | ) | | $ | (329,545 | ) |
Deferred Tax Liabilities: | | | | | |
|
Basis reduction of investment in partnerships | | $ | 6,335,805 |
| | $ | 11,655,817 |
| | $ | 2,675,142 |
|
Net unrealized gain on investment securities | | 28,444 |
| | 2,312,269 |
| | — |
|
Cost recovery of leased assets | | — |
| | — |
| | 50,446 |
|
Sub-total | | 6,364,249 |
| | 13,968,086 |
| | 2,725,588 |
|
Total net deferred tax liability | | $ | 5,332,087 |
| | $ | 7,172,133 |
| | $ | 2,396,043 |
|
For the period ended December 31, 2013, the total deferred tax liability presented above relates to assets held in the Company's TRSs. The Company recognizes the tax benefits of uncertain tax positions only when the position is “more likely than not” to be sustained upon examination by the tax authorities based on the technical merits of the tax position. The Company’s policy is to record interest and penalties on uncertain tax positions as part of tax expense. As of December 31, 2013, the Company had no uncertain tax positions and no penalties and interest were accrued. Tax years subsequent to the year ending November 30, 2007 remain open to examination by federal and state tax authorities.
Total income tax expense differs from the amount computed by applying the federal statutory income tax rate of 35 percent for the years ended December 31, 2013, November 30, 2012, November 30, 2011 and for the one-month transition period ended December 31, 2012 to income or loss from operations and other income and expense for the years presented, as follows:
|
| | | | | | | | | | | | | | | | |
Income Tax Expense (Benefit) |
| | For the Years Ended | | For the One-Month Transition Period Ended |
| | December 31, 2013 | | November 30, 2012 | | November 30, 2011 | | December 31, 2012 |
Application of statutory income tax rate | | $ | 2,608,151 |
| | $ | 6,852,179 |
| | $ | 1,331,750 |
| | $ | (848,239 | ) |
State income taxes, net of federal tax benefit | | 273,174 |
| | 442,455 |
| | 133,158 |
| | (64,771 | ) |
Dividends received deduction | | — |
| | (1,221 | ) | | (86 | ) | | (7,133 | ) |
Income of Real Estate Investment Trust not subject to tax | | (927,254 | ) | | — |
| | — |
| | — |
|
Impact of effective tax rate change due to REIT election | | 995,447 |
| | — |
| | — |
| | — |
|
Other | | — |
| | (64,479 | ) | | (581,965 | ) | | — |
|
Total income tax expense | | $ | 2,949,518 |
| | $ | 7,228,934 |
| | $ | 882,857 |
| | $ | (920,143 | ) |
Total income taxes are computed by applying the federal statutory rate of 35 percent plus a blended state income tax rate, which was approximately 3.11 percent for the year ended December 31, 2013 and 2.26 percent for the other periods presented above. As a REIT, we hold and operate certain of our assets through one or more TRSs. A TRS is a subsidiary of a REIT that is subject to applicable corporate income tax. For the year ended December 31, 2013, all of the income tax expense presented above relates to the assets and activities held in the Company's TRSs. The components of income tax expense include the following for the periods presented:
|
| | | | | | | | | | | | | | | | |
Components of Income Tax Expense (Benefit) |
| | For the Years Ended | | For the One-Month Transition Period Ended |
| | December 31, 2013 | | November 30, 2012 | | November 30, 2011 | | December 31, 2012 |
Current tax expense (benefit) | | | | | | | | |
Federal | | $ | (7,139 | ) | | $ | — |
| | $ | — |
| | $ | 3,610,165 |
|
State (net of federal tax benefit) | | 20,613 |
| | 38,107 |
| | 53,650 |
| | 245,782 |
|
AMT benefit | | — |
| | (8,842 | ) | | 200,000 |
| | — |
|
Total current tax expense (benefit) | | 13,474 |
| | 29,265 |
| | 253,650 |
| | 3,855,947 |
|
Deferred tax expense (benefit) | | | | | |
| | |
Federal | | 2,683,483 |
| | 6,762,974 |
| | 585,386 |
| | (4,465,104 | ) |
State (net of federal tax benefit) | | 252,561 |
| | 436,695 |
| | 43,821 |
| | (310,986 | ) |
Total deferred tax expense (benefit) | | 2,936,044 |
| | 7,199,669 |
| | 629,207 |
| | (4,776,090 | ) |
Total income tax expense (benefit), net | | $ | 2,949,518 |
| | $ | 7,228,934 |
| | $ | 882,857 |
| | $ | (920,143 | ) |
As of November 30, 2012, the Company had a net operating loss for federal income tax purposes of approximately $17.2 million. The net operating loss may be carried forward for 20 years. If not utilized, this net operating loss would have expired as follows: $8 thousand, $4.0 million, $3.4 million, $24 thousand and $9.8 million in the years ending November 30, 2028, 2029, 2030, 2031 and 2032, respectively. In the period ending December 31, 2012, all Net Operating Losses of the Company were utilized to reduce the Company's current tax liability. A Net Operating Loss of $160 thousand has been incurred by a TRS for the year ended December 31, 2013. As of November 30, 2012, an alternative minimum tax credit of $194 thousand was available, which was fully utilized as of December 31, 2012.
The aggregate cost of securities for federal income tax purposes and securities with unrealized appreciation and depreciation, were as follows:
|
| | | | | | | | | | | | |
Aggregate Cost of Securities for Income Tax Purposes |
| | December 31, 2013 | | November 30, 2012 | | December 31, 2012 |
Aggregate cost for federal income tax purposes | | $ | 6,604,636 |
| | $ | 41,995,195 |
| | $ | 22,007,069 |
|
Gross unrealized appreciation | | 16,699,686 |
| | 33,892,176 |
| | 2,018,455 |
|
Gross unrealized depreciation | | — |
| | (801,340 | ) | | — |
|
Net unrealized appreciation | | $ | 16,699,686 |
| | $ | 33,090,836 |
| | $ | 2,018,455 |
|
The Company provides the following tax information to its common stockholders pertaining to the character of distributions paid during tax year 2013, 2012, and 2011. For a stockholder that received all distributions in cash during 2013, 43 percent will be treated as qualified dividend income and 57 percent will be treated as return of capital. The per share characterization by quarter is reflected in the following table:
|
| | | | | | | | | | | | | | | | | | | | | | | | |
2013 Common Stock Tax Information |
Record Date | | Ex-Dividend Date | | Payable Date | | Total Distribution per Share | | Total Ordinary Dividends | | Qualified Dividends | | Capital Gain Distributions | | Nondividend Distributions |
03/08/2013 | | 03/06/2013 | | 03/19/2013 | | $ | 0.1250 |
| | $ | 0.1250 |
| | $ | 0.1250 |
| | $ | — |
| | $ | — |
|
06/28/2013 | | 06/26/2013 | | 07/05/2013 | | 0.1250 |
| | 0.0367 |
| | 0.0367 |
| | — |
| | 0.0883 |
|
09/30/2013 | | 09/26/2013 | | 10/04/2013 | | 0.1250 |
| | — |
| | — |
| | — |
| | 0.1250 |
|
Total 2013 Distributions | | $ | 0.3750 |
| | $ | 0.1617 |
| | $ | 0.1617 |
| | $ | — |
| | $ | 0.2133 |
|
|
| | | | | | | | | | | | | | | | | | | | | | | | |
2012 Common Stock Tax Information |
Record Date | | Ex-Dividend Date | | Payable Date | | Total Distribution per Share | | Total Ordinary Dividends | | Qualified Dividends | | Capital Gain Distributions | | Nondividend Distributions |
02/22/2012 | | 02/17/2012 | | 03/01/2012 | | $ | 0.1100 |
| | $ | — |
| | $ | — |
| | $ | — |
| | $ | 0.1100 |
|
05/23/2012 | | 05/21/2012 | | 06/01/2012 | | 0.1100 |
| | — |
| | — |
| | — |
| | 0.1100 |
|
08/24/2012 | | 08/22/2012 | | 09/04/2012 | | 0.1100 |
| | — |
| | — |
| | — |
| | 0.1100 |
|
11/23/2012 | | 11/20/2012 | | 11/30/2012 | | 0.1100 |
| | — |
| | — |
| | — |
| | 0.1100 |
|
Total 2012 Distributions | | $ | 0.4400 |
| | $ | — |
| | $ | — |
| | $ | — |
| | $ | 0.4400 |
|
|
| | | | | | | | | | | | | | | | | | | | | | | | |
2011 Common Stock Tax Information |
Record Date | | Ex-Dividend Date | | Payable Date | | Total Distribution per Share | | Total Ordinary Dividends | | Qualified Dividends | | Capital Gain Distributions | | Nondividend Distributions |
02/18/2011 | | 02/16/2011 | | 03/01/2011 | | $ | 0.1000 |
| | $ | 0.1000 |
| | $ | 0.1000 |
| | $ | — |
| | $ | — |
|
05/24/2011 | | 05/20/2011 | | 06/01/2011 | | 0.1000 |
| | 0.1000 |
| | 0.1000 |
| | — |
| | — |
|
08/24/2011 | | 08/22/2011 | | 09/01/2011 | | 0.1000 |
| | 0.1000 |
| | 0.1000 |
| | — |
| | — |
|
11/22/2011 | | 11/18/2011 | | 11/30/2011 | | 0.1100 |
| | 0.1100 |
| | 0.1100 |
| | — |
| | — |
|
Total 2011 Distributions | | $ | 0.4100 |
| | $ | 0.4100 |
| | $ | 0.4100 |
| | $ | — |
| | $ | — |
|
We elected to be treated as a REIT for federal income tax purposes (which we refer to as the “REIT Election”) for the calendar and tax year ended December 31, 2013. The Company satisfied the annual income test and the quarterly assets tests necessary for us to qualify to be taxed as a REIT for 2013. Distributions made during 2013 and treated as qualifying dividend income relate to pre-REIT tax years earnings and profits that were required to be distributed by calendar year end 2013.
6. PROPERTY AND EQUIPMENT
Property and equipment consists of the following:
|
| | | | | | | | | | | | |
Property and Equipment |
| | December 31, 2013 | | November 30, 2012 | | December 31, 2012 |
Natural gas pipeline | | $ | 5,215,424 |
| | $ | 5,215,424 |
| | $ | 5,215,424 |
|
Vehicles and trailers | | 125,117 |
| | 110,782 |
| | 110,782 |
|
Computers | | 15,627 |
| | 14,018 |
| | 14,440 |
|
Gross property and equipment | | 5,356,168 |
| | 5,340,224 |
| | 5,340,646 |
|
Less: accumulated depreciation | | (2,037,685 | ) | | (1,751,202 | ) | | (1,774,616 | ) |
Net property and equipment | | $ | 3,318,483 |
| | $ | 3,589,022 |
| | $ | 3,566,030 |
|
The amounts of depreciation of property and equipment recognized for the years ended December 31, 2013 and November 30, 2012 and the one-month transition period ended December 31, 2012 were $283 thousand, $281 thousand, and $23 thousand, respectively. The amount depreciation of property and equipment recognized for the period from September 21, 2011 through November 30, 2011 was $70 thousand.
7. CONCENTRATIONS
Prior to 2013, the Company had historically invested in securities of privately-held and publicly-traded companies in the midstream and downstream segments of the U.S. energy infrastructure sector. As of December 31, 2013, investments in securities of energy infrastructure companies represented approximately 8.21 percent of the Company’s total assets. The Company is now focused on identifying and acquiring real property assets in the U.S. energy infrastructure sector that are REIT-qualified.
Mowood, the Company’s wholly-owned subsidiary, has a ten-year contract, expiring in 2015, with the Department of Defense (“DOD”) to provide natural gas supply and distribution services to Fort Leonard Wood. Revenue related to the DOD contract accounted for 80 percent, 71 percent, 88 percent and 84 percent of our sales revenue for the years ended December 31, 2013, November 30, 2012, the period from September 21, 2011 through November 30, 2011, and for the one-month transition period ended December 31, 2012, respectively. Mowood, through its wholly-owned subsidiary Omega, performs management and supervision services related to the expansion of the natural gas distribution system used by the DOD. The amount due from the DOD accounts for 91 percent, 84 percent and 79 percent of the consolidated accounts receivable balances as of December 31, 2013 and November 30, 2012, and for the one-month transition period ended December 31, 2012, respectively.
Mowood’s contracts for its supply of natural gas are concentrated among select providers. Purchases from its largest supplier of natural gas accounted for 41 percent of our cost of sales for the year ended December 31, 2013. This compares to 29 percent and 58 percent for the year ended November 30, 2012 and the one-month transition period ended December 31, 2012, respectively.
8. MANAGEMENT AND ADVISORY AGREEMENTS
On December 1, 2011, the Company executed a Management Agreement with Corridor InfraTrust Management, LLC (“Corridor”). Under the Management Agreement, Corridor (i) presents the Company with suitable acquisition opportunities consistent with the investment policies and objectives of the Company, (ii) is responsible for the day-to-day operations of the Company, and (iii) performs such services and activities relating to the assets and operations of the Company as may be appropriate. The terms of the Management Agreement include a quarterly management fee equal to 0.25 percent (1.00 percent annualized) of the value of the Company’s average monthly Managed Assets for such quarter. For purposes of the Management Agreement, “Managed Assets” means all of the securities of the Company and all of the real property assets of the Company (including any securities or real property assets purchased with or attributable to any borrowed funds) minus all of the accrued liabilities other than (1) deferred taxes and (2) debt entered into for the purpose of leverage. For purposes of the definition of Managed Assets, “securities” includes the Company’s security portfolio, valued at then current market value. For purposes of the definition of Managed Assets, “real property assets” includes the assets of the Company invested, directly or indirectly, in equity interests in or loans secured by real estate and personal property owned in connection with such real estate (including acquisition related costs and acquisition costs that may be allocated to intangibles or are unallocated), valued at the aggregate historical cost, before reserves for depreciation, amortization, impairment charges or bad debts or other similar noncash reserves.
The Management Agreement also includes a quarterly incentive fee of 10 percent of the increase in distributions paid over a threshold distribution equal to $0.125 per share per quarter. The Management Agreement also requires at least half of any incentive
fees to be reinvested in the Company’s common stock. A new Management Agreement between the Company and Corridor was approved by the Board of Directors and became effective July1, 2013. The new agreement does not change in any respect the terms for determination or payment of compensation for the Manager, does not have a specific term, and will remain in place unless terminated by the Company or the Manager in the manner permitted pursuant to the agreement.
During the fourth quarter of 2012, Corridor assumed the TCA’s Administrative Agreement, retroactive to August 7, 2012. Tortoise Capital Advisors, L.L.C. (“TCA”) served as the Company’s administrator until that date. The Company pays the administrator a fee equal to an annual rate of 0.04 percent of aggregate average daily managed assets, with a minimum annual fee of $30 thousand.
On December 1, 2011, we entered into an Advisory Agreement by and among the Company, TCA and Corridor, under which TCA provided certain securities focused investment services necessary to evaluate, monitor and liquidate the Company’s remaining securities portfolio (“Designated Advisory Services”), and also provided the Company with certain operational (i.e. non-investment) services (“Designated Operational Services”). Effective December 21, 2012, that agreement was replaced by an Amended Advisory Agreement pursuant to which TCA provides investment services related to the monitoring and disposition of our current securities portfolio.
U.S. Bancorp Fund Services, LLC serves as the Company’s fund accounting services provider. The Company pays the provider a monthly fee computed at an annual rate of $24 thousand on the first $50 million of the Company’s Net Assets, 0.0125 percent on the next $200 million of the Company's Net Assets, 0.0075 percent on the next $250 million of the Company's Net Assets and 0.0025 percent on the balance of the Company’s Net Assets.
9. FAIR VALUE
The inputs or methodology used for valuing securities are not necessarily an indication of the risk associated with investing in those securities. The following tables provide the fair value measurements of applicable Company assets and liabilities by level within the fair value hierarchy as of December 31, 2013, November 30, 2012, and December 31, 2012. These assets and liabilities are measured on a recurring basis.
|
| | | | | | | | | | | | | | | | |
December 31, 2013 |
| | December 31, 2013 | | Fair Value |
| | | Level 1 | | Level 2 | | Level 3 |
Assets: | | | | | | | | |
Trading securities | | $ | — |
| | $ | — |
| | $ | — |
| | $ | — |
|
Other equity securities | | 23,304,321 |
| | — |
| | — |
| | 23,304,321 |
|
Total Assets | | $ | 23,304,321 |
| | $ | — |
| | $ | — |
| | $ | 23,304,321 |
|
|
| | | | | | | | | | | | | | | | |
November 30, 2012 |
| | November 30, 2012 | | Fair Value |
| | | Level 1 | | Level 2 | | Level 3 |
Assets: | | | | | | | | |
Trading securities | | $ | 55,219,411 |
| | $ | 27,480,191 |
| | $ | 27,739,220 |
| | $ | — |
|
Other equity securities | | 19,866,621 |
| | — |
| | — |
| | 19,866,621 |
|
Total Assets | | $ | 75,086,032 |
| | $ | 27,480,191 |
| | $ | 27,739,220 |
| | $ | 19,866,621 |
|
|
| | | | | | | | | | | | | | | | |
December 31, 2012 |
| | December 31, 2012 | | Fair Value |
| | | Level 1 | | Level 2 | | Level 3 |
Assets: | | | | | | | | |
Trading securities | | $ | 4,318,398 |
| | $ | 4,318,398 |
| | $ | — |
| | $ | — |
|
Other equity securities | | 19,707,126 |
| | — |
| | — |
| | 19,707,126 |
|
Total Assets | | $ | 24,025,524 |
| | $ | 4,318,398 |
| | $ | — |
| | $ | 19,707,126 |
|
The changes for all Level 3 securities measured at fair value on a recurring basis using significant unobservable inputs for the years ended December 31, 2012, November 30, 2012, and for the one-month transition period ended December 31, 2012 are as follows:
|
| | | | | | | | | | | |
| For the Years Ended | | For the One-Month Transition Period Ended |
| December 31, 2013 | | November 30, 2012 | | December 31, 2012 |
Fair value beginning balance | $ | 19,707,126 |
| | $ | 41,856,730 |
| | $ | 19,866,621 |
|
Total realized and unrealized gains (losses) included in net income | 5,292,890 |
| | 16,190,428 |
| | (159,495 | ) |
Sales | — |
| | (35,919,672 | ) | | — |
|
Return of capital adjustments impacting cost basis of securities | (1,695,695 | ) | | (2,260,865 | ) | | — |
|
Fair value ending balance | $ | 23,304,321 |
| | $ | 19,866,621 |
| | $ | 19,707,126 |
|
Changes in unrealized gains, included in net income, relating to securities still held (1) | $ | 5,292,890 |
| | $ | 5,018,152 |
| | $ | (159,495 | ) |
(1) Located in Net realized and unrealized gain (loss) on other equity securities in the Consolidated Statements of Income
As of November 30, 2011, the Company’s other equity securities, which represented equity interests in private companies, and were classified as Level 3 assets, included High Sierra Energy, LP. On June 19, 2012, NGL Energy Partners, LP and certain of its affiliates (collectively “NGL”) acquired High Sierra Energy, LP and High Sierra Energy GP, LLC (collectively “High Sierra”) pursuant to which NGL, a New York Stock Exchange listed company, paid to the limited partners of High Sierra approximately $9.4 million in cash and approximately 1.2 million newly issued units of NGL. A realized gain of $15.8 million was recognized during the third quarter of 2012 upon the sale. These NGL units are classified as a Level 2 Trading security above as of November 30, 2012. The Company had liquidated all its NGL holdings by March 31, 2013.
The Company utilizes the beginning of reporting period method for determining transfers between levels. There were no transfers between levels 1, 2 or 3 for the years ended December 31, 2013, November 30, 2012, or the period from December 1, 2012 through December 31, 2012.
In accordance with ASC 820, The Company fair values their derivative financial instruments. Please refer to Footnote 12, Interest Rate Hedge Swaps, for more information.
Valuation Techniques and Unobservable Inputs
An equity security of a publicly traded company acquired in a private placement transaction without registration under the Securities Act of 1933, as amended (the “1933 Act”), is subject to restrictions on resale that can affect the security’s liquidity (and hence its fair value). If the security has a common share counterpart trading in a public market, the Company generally determines an appropriate percentage discount for the security in light of the restrictions that apply to its resale (taking into account, for example, whether the resale restrictions of Rule 144 under the 1933 Act apply). This pricing methodology applies to the Company’s Level 2 trading securities.
The Company’s other equity securities, which represent securities issued by private companies, are classified as Level 3 assets. Valuation of these investments is determined by weighting various valuation metrics for each security. If the Company holds an investment in a private company, who holds restricted shares in a publicly traded company, the same pricing methodology that applies to the Company's level 2 trading securities mentioned above would apply. Significant judgment is required in selecting the assumptions used to determine the fair values of these investments. See Note 2, Significant Accounting Policies.
The Company’s investments in private companies are typically valued using one of or a combination of the following valuation techniques: (i) analysis of valuations for publicly traded companies in a similar line of business (“public company analysis”), (ii) analysis of valuations for comparable M&A transactions (“M&A analysis”) and (iii) discounted cash flow analysis. The table entitled “Quantitative Table for Valuation Techniques” outlines the valuation technique(s) used for each asset category.
The public company analysis utilizes valuation multiples for publicly traded companies in a similar line of business as the portfolio company to estimate the fair value of such investment. Typically, the Company’s analysis focuses on the ratio of enterprise value ("EV") to earnings before interest expense, income tax expense, depreciation and amortization (“EBITDA”) which is commonly
referred to as an EV/EBITDA multiple. The Company selects a range of multiples given the trading multiples of similar publicly traded companies and applies such multiples to the portfolio company’s EBITDA to estimate the portfolio company’s trailing, proforma, projected or average (as appropriate) EBITDA to estimate the portfolio company’s enterprise value and equity value. The Company also selects a range of trading market yields of similar public companies and applies such yields to the portfolio company’s estimated distributable cash flow. When calculating these values, the Company applies a discount, when applicable, to the portfolio company’s estimated equity value for the size of the company and the lack of liquidity in the portfolio company’s securities.
The M&A analysis utilizes valuation multiples for historical M&A transactions for companies or assets in a similar line of business as the portfolio company to estimate the fair value of such investment. Typically, the Company’s analysis focuses on EV/EBITDA multiples. The Company selects a range of multiples based on EV/EBITDA multiples for similar M&A transactions or similar companies and applies such ranges to the portfolio company’s analytical EBITDA to estimate the portfolio company’s enterprise value.
The discounted cash flow ("DCF") analysis is used to estimate the equity value for the portfolio company based on estimated DCF of such portfolio company. Such cash flows include an estimate of terminal value for the portfolio company. A present value of these cash flows is determined by using estimated discount rates (based on the Company’s estimate for weighted average cost of capital for such portfolio company).
Under all of these valuation techniques, the Company estimates operating results of its portfolio companies (including EBITDA). These estimates utilize unobservable inputs such as historical operating results, which may be unaudited, and projected operating results, which will be based on expected operating assumptions for such portfolio company. The Company also consults with management of the portfolio companies to develop these financial projections. These estimates will be sensitive to changes in assumptions specific to such portfolio company as well as general assumptions for the industry. Other unobservable inputs utilized in the valuation techniques outlined above include: possible discounts for lack of marketability, selection of publicly-traded companies, selection of similar M&A transactions, selected ranges for valuation multiples, selected range of yields and expected required rates of return and weighted average cost of capital. The various inputs will be weighted as appropriate, and other factors may be weighted into the valuation, including recent capital transactions of the Company.
Changes in EBITDA multiples, or discount rates may change the fair value of the Company’s portfolio investments. Generally, a decrease in EBITDA multiples or DCF multiples, or an increase in discount rates, when applicable, may result in a decrease in the fair value of the Company’s portfolio investments.
Due to the inherent uncertainty of determining the fair value of investments that do not have a readily available market value, the fair value of the Company’s investments may fluctuate from period to period. Additionally, the fair value of the Company’s investments may differ from the values that would have been used had a ready market existed for such investments and may differ materially from the values that the Company may ultimately realize.
The following table summarizes the significant unobservable inputs that the Company uses to value its portfolio investments categorized as Level 3 as of December 31, 2013, November 30, 2012 and December 31, 2012.
Quantitative Table for Valuation Techniques
|
| | | | | | | | | | | | | | |
Significant Unobservable Inputs Used To Value Portfolio Investments |
December 31, 2013 |
| | | | | | Unobservable Inputs | | Range | | Weighted Average |
Assets at Fair Value | | Fair Value | | Valuation Technique | | | Low | | High | |
Other equity securities, at fair value | | $ | 23,304,321 |
| | Public company historical EBITDA analysis | | Historical EBITDA Valuation Multiples | | 9.6x | | 10.6x | | 10.1x |
| | | | Public company projected EBITDA analysis | | Projected EBITDA Valuation Multiples | | 8.3x | | 9.3x | | 8.8x |
| | | | M&A company analysis | | EV/LTM 2012 EBITDA | | 8.3x | | 9.3x | | 8.8x |
| | | | Discounted cash flow | | Weighted Average Cost of Capital | | 9.5% | | 14.0% | | 11.8% |
|
| | | | | | | | | | | | | | |
November 30, 2012 |
| | | | | | Unobservable Inputs | | Range | | Weighted Average |
Assets at Fair Value | | Fair Value | | Valuation Technique | | | Low | | High | |
Other equity securities, at fair value | | $ | 19,866,621 |
| | Public company historical EBITDA analysis | | Historical EBITDA Valuation Multiples | | 9.4x | | 10.4x | | 9.95x |
| | | | Public company projected EBITDA analysis | | Projected EBITDA Valuation Multiples | | 8.1x | | 9.8x | | 8.95x |
| | | | Public company yield analysis | | Distributable Cash Flow Yield | | 8.11% | | 9.11% | | 8.61% |
| | | | M&A company analysis | | EV/LTM 2012 EBITDA | | 9.3x | | 9.9x | | 9.6x |
| | | | Discounted cash flow | | Weighted Average Cost of Capital | | 9.5% | | 13.0% | | 11.25% |
|
| | | | | | | | | | | | | | |
December 31, 2012 |
| | | | | | Unobservable Inputs | | Range | | Weighted Average |
Assets at Fair Value | | Fair Value | | Valuation Technique | | | Low | | High | |
Other equity securities, at fair value | | $ | 19,707,126 |
| | Public company historical EBITDA analysis | | Historical EBITDA Valuation Multiples | | 9.5x | | 11.6x | | 10.6x |
| | | | Public company projected EBITDA analysis | | Projected EBITDA Valuation Multiples | | 8.8x | | 10.1x | | 9.5x |
| | | | M&A company analysis | | EV/LTM 2012 EBITDA | | 8.9x | | 10.3x | | 9.6x |
| | | | Discounted cash flow | | Weighted Average Cost of Capital | | 9.5% | | 13.0% | | 11.3% |
As of December 31, 2013, November 30, 2012, and December 31, 2012 the Company held a 6.7 percent equity interest in Lightfoot Capital Partners LP and an 11.1 percent equity interest in VantaCore Partners LP.
The following section describes the valuation methodologies used by the Company for estimating fair value for financial instruments not recorded at fair value, but fair value is included for disclosure purposes only, as required under disclosure guidance related to the fair value of financial instruments.
Cash and Cash Equivalents — The carrying value of cash, amounts due from banks, federal funds sold and securities purchased under resale agreements approximates fair value.
Escrow Receivable — The escrow receivable due to the Company as of November 30, 2012, which relates to the sale of International Resource Partners, LP, was anticipated to be released upon satisfaction of certain post-closing obligations and/or the expiration of certain time periods (the shortest of which was to be 14 months from the April 2011 closing date of the sale). As of November 30, 2012, the fair value of the escrow receivable reflected a discount for the potential that the full amount due to the Company would not be realized. No clear agreement had been reached as to the remaining escrow balance and management anticipated that it may take more than a year to satisfy other post-closing obligations, prior to receiving the approximately $699 thousand escrow balance. The final payment from the sale was received as of June 30, 2013.
Long-term Debt — The fair value of the Company’s long-term debt is calculated, for disclosure purposes, by discounting future cash flows by a rate equal to the Company’s current expected rate for an equivalent transaction.
Line of Credit — The carrying value of the line of credit approximates the fair value due to its short term nature.
|
| | | | | | | | | | | | | | | | | | | | | | | | | | |
Carrying and Fair Value Amounts |
| | Level within fair value hierarchy | | December 31, 2013 | | November 30, 2012 | | December 31, 2012 |
| | | Carrying Amount | | Fair Value | | Carrying Amount | | Fair Value | | Carrying Amount | | Fair Value |
Financial Assets: | | | | | | | | | | | | | | |
Cash and cash equivalents | | Level 1 | | $ | 17,963,266 |
| | $ | 17,963,266 |
| | $ | 14,333,456 |
| | $ | 14,333,456 |
| | $ | 17,680,783 |
| | $ | 17,680,783 |
|
Escrow receivable | | Level 2 | | $ | — |
| | $ | — |
| | $ | 698,729 |
| | $ | 698,729 |
| | $ | 698,729 |
| | $ | 698,729 |
|
Financial Liabilities: | | | | | | | | | | | | |
Long-term debt | | Level 2 | | $ | 70,000,000 |
| | $ | 70,000,000 |
| | $ | — |
| | $ | — |
| | $ | 70,000,000 |
| | $ | 70,000,000 |
|
Line of credit | | Level 1 | | $ | 81,935 |
| | $ | 81,935 |
| | $ | 120,000 |
| | $ | 120,000 |
| | $ | — |
| | $ | — |
|
10. INTANGIBLES
The Company has recorded an intangible lease asset, related to the PNM Lease Agreement, for the fair value of the amount by which the remaining contractual lease payments exceed market lease rates at the time of acquisition. The intangible lease asset is being amortized on a straight-line basis over the life of the lease term, which expires on April 1, 2015. Annual amortization of the intangible lease asset totaling $292 thousand for the years ended December 31, 2013 and November 30, 2012, $122 thousand for the year ended November 30, 2011, and monthly amortization of $24 thousand for the one-month transition period ended December 31, 2012, is reflected in the accompanying Consolidated Statements of Income as a reduction to lease revenue. These same amounts are included in Amortization expense in the accompanying Consolidated Statements of Cash Flows.
|
| | | | | | | | | | | | |
Intangible Lease Asset |
| | December 31, 2013 | | November 30, 2012 | | December 31, 2012 |
Intangible lease asset | | $ | 1,094,771 |
| | $ | 1,094,771 |
| | $ | 1,094,771 |
|
Accumulated amortization | | (729,847 | ) | | (413,580 | ) | | (437,908 | ) |
Net intangible lease asset | | $ | 364,924 |
|
| $ | 681,191 |
| | $ | 656,863 |
|
|
| | | | |
Remaining Estimated Amortization On Intangibles |
Year ending December 31, | | Amount |
2014 | | 291,939 |
|
2015 | | 72,985 |
|
Total | | $ | 364,924 |
|
11. CREDIT FACILITIES
On December 20, 2012, Pinedale LP closed on a $70 million secured term credit facility with KeyBank serving as a lender and as administrative agent on behalf of other lenders participating in the credit facility. Funding of the credit facility was conditioned on our contribution of the proceeds of the stock issuance to Pinedale LP and the receipt by Pinedale LP of the $30 million co-investment funds from Prudential. Outstanding balances under the credit facility will generally accrue interest at a variable annual rate equal to LIBOR plus 3.25 percent (3.42 percent as of December 31, 2013). The credit facility will remain in effect through December 2015, with an option to extend through December 2016. The credit facility is secured by the Pinedale LGS. Pinedale LP is obligated to pay all accrued interest quarterly and is further obligated to make monthly principal payments, beginning March 7, 2014, in the amount of $294 thousand or 0.42 percent of the principal balance as of March 1, 2014. The registrant has provided to KeyBank a guarantee against certain inappropriate conduct by or on behalf of Pinedale LP or us. The credit agreement contains, among other restrictions, specific financial covenants including the maintenance of certain financial coverage ratios and a minimum net worth requirement. The Company is required to maintain a restricted collateral account into which Ultra Wyoming makes all lease payments under the Pinedale Lease Agreement. Payments of principal and interest pursuant to the credit facility are drawn by KeyBank directly from the restricted collateral account prior to transferring the remaining cash to the Pinedale LP operating account. The balance in the restricted collateral account at December 31, 2013 was $0. As of December 31, 2013, Pinedale LP was in compliance with all of the financial covenants of the secured term credit facility.
Pinedale LP's credit facility with KeyBank limits distributions by Pinedale LP to the Company until the Company has qualified as a REIT under the Code. The KeyBank credit facility also requires that Pinedale maintain minimum net worth levels and certain
leverage ratios, which along with other provisions of the credit facility limit cash dividends and loans to the Company. At December 31, 2013, restricted net assets were $93.2 million. Under the most restrictive covenants, consolidated retained earnings in the amount of $22.9 million were free of limitations on the payment of dividends on December 31, 2013.
As of December 31, 2013, November 30, 2012, and December 31, 2012, approximately $1.0 million, $0 and $1.5 million, respectively, in net deferred debt issuance costs are included in the accompanying Consolidated Balance Sheets. The deferred costs will be amortized over the anticipated three-year term of the KeyBank credit facility. For the years ended December 31, 2013, November 30, 2012 and 2011 and the one-month transition period ended December 31, 2012, $515 thousand, $0, $0, and $17 thousand, respectively, is included in interest expense within the accompanying Consolidated Statements of Income.
We have executed interest rate swap derivatives to add stability to our interest expense and to manage our exposure to interest rate movements on our LIBOR based borrowings. Interest rate swaps involve the receipt of variable-rate amounts from a counterparty in exchange for us making fixed-rate payments over the life of the agreements without exchange of the underlying notional amount. See Note 12 for further information regarding interest rate swap derivatives.
On May 8, 2013, the registrant entered into a $20 million revolving line of credit with KeyBank (the "Revolver"). The primary term of the facility is three years with the option for a one-year extension. Outstanding balances under Revolver will accrue interest at a variable annual rate equal to LIBOR plus 4.0 percent or the Prime Rate plus 2.75 percent at our election. We intend to use the facility to fund general working capital needs and if necessary, to provide short-term financing for the acquisition of additional real property assets. The amount available to be drawn under this facility is subject to a borrowing base limitation. If we were to use the Revolver to provide short-term financing for an acquisition, we would expect the assets acquired to be taken into consideration in determining the borrowing base. As of December 31, 2013 there had been no borrowings against the Revolver and $20 million in unused capacity available.
As of December 31, 2013, November 30, 2012, and December 31, 2012, approximately $208 thousand, $0 and $0 in net deferred debt issuance costs are included in the accompanying Consolidated Balance Sheets. The deferred costs will be amortized over the anticipated four-year term of the Revolver facility. For the years ended December 31, 2013, November 30, 2012 and 2011 and the one-month transition period ended December 31, 2012, $41.7 thousand, $0, $0, and $0 is included in interest expense within the accompanying Consolidated Statements of Income.
On October 29, 2010, Mowood entered into a Revolving Note Payable Agreement (“2010 Note Payable Agreement”) with a financial institution with a maximum borrowing base of $1.3 million. The 2010 Note Payable Agreement was amended and restated on October 29, 2011, was again amended and restated on October 29, 2012 and was terminated effective October 29, 2013. Borrowings on the 2010 Note Payable Agreement was secured by all of Mowood’s assets. Interest accrued at LIBOR, plus 4 percent, was payable monthly, with all outstanding principal and accrued interest payable on the termination date of October 29, 2013. The 2010 Note Payable Agreement contained various restrictive covenants, with the most significant relating to minimum consolidated fixed charge ratio, the incidence of additional indebtedness, member distributions, extension of guaranties, future investments in other subsidiaries and change in ownership.
On October 15, 2013, Mowood entered into a Revolving Note Payable Agreement (“2013 Note Payable Agreement”) with a financial institution with a maximum borrowing base of $1.5 million. Borrowings on the 2013 Note Payable Agreement are secured by Mowood’s assets. Interest accrues at Prime Lending Rate as published in the Wall Street Journal, plus 0.5 percent (3.75% as of December 31, 2013), is payable monthly, with all outstanding principal and accrued interest payable on the termination date of October 15, 2014. As of December 31, 2013 there were $82 thousand in outstanding borrowings under this 2013 Note Payable Agreement. The 2013 Note Payable Agreement contains various restrictive covenants, with the most significant relating to minimum consolidated fixed charge ratio, the incidence of additional indebtedness, member distributions, extension of guaranties, future investments in other subsidiaries and change in ownership. Mowood was in compliance with the various covenants of the 2013 Note Payable Agreement as of December 31, 2013.
On November 30, 2011, the Company entered into a 180-day rolling evergreen Margin Loan Facility Agreement (“Margin Loan Agreement”) with Bank of America, N.A. The terms of the Margin Loan Agreement provided for a $10 million facility that was secured by certain of the Company’s assets. Outstanding balances generally accrued interest at a variable rate equal to one-month LIBOR plus 0.75 percent and unused portions of the facility accrued a fee equal to an annual rate of 0.25 percent. In December of 2012, the assets which secured this facility were sold, and as a result, this Margin Loan Agreement was terminated effective December 20, 2012.
12. INTEREST RATE HEDGE SWAPS
Derivative Financial Instruments
Currently, the Company uses interest rate swaps to manage its interest rate risk. The valuation of these instruments is determined using widely accepted valuation techniques including discounted cash flow analysis on the expected cash flows of each derivative. This analysis reflects the contractual terms of the derivatives, including the period to maturity, and uses observable market-based inputs, including forward interest rate curves. The fair values of interest rate swaps are determined using the market standard methodology of netting the discounted future fixed cash payments and the discounted expected variable cash receipts. The variable cash receipts are based on an expectation of future interest rates (forward curves) derived from observable market interest rate forward curves.
To comply with the provisions of ASC 820, the Company incorporates credit valuation adjustments to appropriately reflect both its own nonperformance risk and the respective counterparty's nonperformance risk in the fair value measurements. In adjusting the fair value of its derivative contracts for the effect of nonperformance risk, the Company has considered the impact of netting and any applicable credit enhancements, such as collateral postings, thresholds, mutual puts, and guarantees. In conjunction with the FASB's fair value measurement guidance in ASC 820, the Company made an accounting policy election to measure the credit risk of its derivative financial instruments that are subject to master netting agreements on a net basis by counterparty portfolio.
Although the Company has determined that the majority of the inputs used to value its derivatives fall within Level 2 of the fair value hierarchy, the credit valuation adjustments associated with its derivatives utilize Level 3 inputs, such as estimates of current credit spreads to evaluate the likelihood of default by itself and its counterparties. However, as of December 31, 2013, the Company has assessed the significance of the impact of the credit valuation adjustments on the overall valuation of its derivative positions and has determined that the credit valuation adjustments are not significant to the overall valuation of its derivatives. As a result, the Company has determined that its derivative valuations in their entirety are classified in Level 2 of the fair value hierarchy.
The table below presents the Company's assets and liabilities measured at fair value on a recurring basis as well as their classification on the Consolidated Balance Sheets as of December 31, 2013 and December 31, 2012, aggregated by the level in the fair value hierarchy within which those measurements fall. Hedges that are valued as receivable by the Company are considered Asset Derivatives and those that are valued as payable by the Company are considered Liability Derivatives. There were no outstanding derivative financial instruments as of November 30, 2012.
|
| | | | | | | | | | | | | | | |
Derivative Financial Instruments Measured At Fair Value on a Recurring Basis |
| | Balance Sheet Classification | | | Fair Value Hierarchy |
Balance Sheet Line Item | | | | Level 1 | | Level 2 | | Level 3 |
| | | | | December 31, 2013 |
Hedged derivative asset | | Assets | | | $ | — |
| | $ | 680,968 |
| | $ | — |
|
Hedged derivative liability | | Liabilities | | | $ | — |
| | $ | — |
| | $ | — |
|
| | | | | | | | | |
| | | | | December 31, 2012 |
Prepaid expenses and other assets | | Assets | | | $ | — |
| | $ | — |
| | $ | — |
|
Accounts payable and other accrued liabilities | | Liabilities | | | $ | — |
| | $ | 316,756 |
| | $ | — |
|
| | | | | | | | | |
Level 1 – quoted prices in active markets for identical investments |
Level 2 – other significant observable inputs (including quoted prices for similar investments, market corroborated inputs, etc.) |
Level 3 – significant unobservable inputs (including the Company’s own assumptions in determining the fair value of investments) |
Risk Management Objective of Using Derivatives
The Company is exposed to certain risk arising from both its business operations and economic conditions. The Company principally manages its exposures to a wide variety of business and operational risks through management of its core business activities. The Company manages economic risks, including interest rate, liquidity, and credit risk primarily by managing the amount, sources, and duration of its debt funding and the use of derivative financial instruments. Specifically, the Company enters into derivative financial instruments to manage exposures that arise from business activities that result in the receipt or payment of future known and uncertain cash amounts, the value of which are determined by interest rates. The Company's derivative financial instruments are used to manage differences in the amount, timing, and duration of the Company's known or expected cash receipts and its known or expected cash payments principally related to the Company's investments and borrowings.
Cash Flow Hedges of Interest Rate Risk
The Company's objectives in using interest rate derivatives are to add stability to interest expense and to manage its exposure to interest rate movements. To accomplish this objective, the Company primarily uses interest rate swaps and caps as part of its interest rate risk management strategy. Interest rate swaps designated as cash flow hedges involve the receipt of variable amounts from a counterparty in exchange for the Company making fixed-rate payments over the life of the agreements without exchange of the underlying notional amount. Interest rate caps designated as cash flow hedges involve the receipt of variable amounts from a counterparty if interest rates rise above the strike rate on the contract in exchange for an upfront premium.
The effective portion of changes in the fair value of derivatives designated and that qualify as cash flow hedges is recorded in Accumulated Other Comprehensive Income (“AOCI”) and is subsequently reclassified into earnings in the period that the hedged forecasted transaction affects earnings. The Company elected to designate its interest rate swaps as cash flow hedges in April 2013. During the year ended December 31, 2013, such derivatives were used to hedge the variable cash flows associated with existing variable-rate debt. The ineffective portion of the change in fair value of the derivatives is recognized directly in earnings. During the year ended December 31, 2013 there was a gain of approximately $6,000, due to ineffectiveness, recorded in earnings. Ineffectiveness resulted from interest rate swaps that did not have a fair value of zero at inception of the hedging relationship. The Company did not have any derivatives designated as Cash Flow Hedges during the years ended November 30, 2012 or 2011 or the one-month transition period ended December 31, 2012.
Amounts reported in AOCI related to derivatives will be reclassified to interest expense as interest payments are made on the Company's variable-rate debt. Over the next 12 months, the Company estimates that an additional $264 thousand will be reclassified as an increase to interest expense.
As of December 31, 2013, the Company had the following outstanding interest rate derivatives that were designated as cash flow hedges of interest rate risk:
|
| | | | | | | | | | | | |
Outstanding Derivatives Designated as Cash Flow Hedges of Interest Rate Risk |
Interest Rate Derivative | | Number of Instruments | | Notional Amount Outstanding | | | | | | Floating Rate Received | | Fixed Rate Paid |
| | | Effective Date | | Termination Date | | |
Interest Rate Swap | | 2 | | $52,500,000 | | February 5, 2013 | | December 5, 2017 | | 1-month US Dollar LIBOR | | 0.865% |
Non-Designated Hedges
Derivatives not designated as hedges are not speculative and are used to manage the Company's exposure to interest rate movements and other identified risks. Changes in the fair value of derivatives not designated in hedging relationships are recorded directly in earnings and were equal to net losses of approximately $75 thousand and $317 thousand for the year ended December 31, 2013 and the one-month transition period ended December 31, 2012. The Company did not have any derivatives during the year ended November 30, 2012 or 2011.
As the Company elected to designate its interest rate swaps in cash flow hedging relationships in April 2013 (see Cash Flow Hedges of Interest Rate Risk above), the Company did not have any instruments not designated as hedges as of December 31, 2013.
Tabular Disclosure of the Effect of Derivative Instruments on the Income Statement
The tables below present the effect of the Company's derivative financial instruments on the Income Statement for the years ended December 31, 2013 and November 30, 2012, and for the one-month transition period ended December 31, 2012.
|
| | | | | | | | | | | | | | | | | | | | | | | | | | | | | | |
Effect of Derivative Financial Instruments on Income Statement |
Derivatives in Cash Flow Hedging Relationships | | Amount of Gain (Loss) Recognized in AOCI on Derivative (Effective Portion) | | Location of Gain (Loss) Reclassified from AOCI into Net Income (Effective Portion) | | Amount of Gain (Loss) Reclassified from AOCI on Derivatives (Effective Portion) Recognized in Net Income * | | Location of Gain (Loss) Recognized in Income on Derivative (Ineffective Portion and Amount Excluded from Effectiveness Testing) | | Amount of Gain (Loss) Recognized in Income on Derivative (Ineffective Portion, Amounts Excluded from Effectiveness Testing) |
| | | | |
For the years ended: | | December 31, 2013 | | November 30, 2012 | | | December 31, 2013 | | November 30, 2012 | | | December 31, 2013 | | November 30, 2012 |
Interest Rate Swaps | | $ | 741,344 |
| | $ | — |
| | Interest Expense | | $ | (217,821 | ) | | $ | — |
| | Interest Expense | | $ | 5,969 |
| | $ | — |
|
For the one-month transition period ended: | | December 31, 2012 | | | | | | December 31, 2012 | | | | | | December 31, 2012 | | |
Interest Rate Swaps | | $ | — |
| | | | | | $ | — |
| | | | | | $ | — |
| | |
Derivatives Not Designated as Hedging Instruments | | Location of Gain (Loss) Recognized in Income on Derivative | | Amount of Gain (Loss) Recognized in Income on Derivative * | | | | | | |
| | For the Years Ended | | For the One-Month transition Period Ended December 31, 2012 | | | | |
| | December 31, 2013 | | November 30, 2012 | | | | | | | |
Interest Rate Swaps | | Interest Expense | | $ | (75,200 | ) | | $ | — |
| | $ | (316,756 | ) | | | | | | |
* The gain or (loss) recognized in income on derivatives includes changes in fair value of the derivatives as well as the periodic cash settlements and interest accruals for derivatives not designated as hedging instruments |
Tabular Disclosure of Offsetting Derivatives
The table below presents a gross presentation, the effects of offsetting, and a net presentation of the Company's derivatives as of December 31, 2013 and December 31, 2012. The net amounts of derivative assets or liabilities can be reconciled to the tabular disclosure of fair value. The tabular disclosure of fair value provides the location that derivative assets and liabilities are presented on the Balance Sheet. There were no offsetting derivative liabilities as of December 31, 2013 and no offsetting derivative assets as of December 31, 2012.
|
| | | | | | | | | | | | | | | | | | | | | | | | |
Offsetting Derivatives |
| | Gross Amounts of Recognized Assets | | Gross Amounts Offset in the Statement of Financial Position | | Net Amounts of Assets presented in the Statement of Financial Position | | Gross Amounts Not Offset in the Statement of Financial Position | | |
| | | | | |
| | | | | Financial Instruments | | Cash Collateral Received | | Net Amount |
Offsetting Derivative Assets as of December 31, 2013 | | $ | 680,968 |
| | $ | — |
| | $ | 680,968 |
| | $ | — |
| | $ | — |
| | $ | 680,968 |
|
| | | | | | | | | | | | |
Offsetting Derivative Liabilities as of December 31, 2012 | | $ | 316,756 |
| | $ | — |
| | $ | 316,756 |
| | $ | — |
| | $ | — |
| | $ | 316,756 |
|
Credit-Risk Related Contingent Features
The Company has agreements with some of its derivative counterparties that contain a provision where if the Company defaults on any of its indebtedness, including default where repayment of the indebtedness has not been accelerated by the lender, then the company could also be declared in default on its derivative obligations.
As of December 31, 2013, the Company did not have any derivatives that were in a net liability position. Therefore, the credit risk-related contingent features discussed above would not apply as of December 31, 2013.
13. WARRANTS
At December 31, 2013 and 2012 and November 30, 2012, the Company had 945,594 warrants issued and outstanding. The warrants were issued to stockholders who invested in the Company’s initial private placements and became exercisable on February 7, 2007 (the closing date of the Company’s initial public offering of common shares), subject to a lock-up period with respect to the underlying common shares. Each warrant entitled the holder to purchase one common share at the exercise price of $11.41 per common share. Warrants were issued as separate instruments from the common shares and are permitted to be transferred independently from the common shares. The warrants had no voting rights and the common shares underlying the unexercised warrants had no voting rights until such common shares were received upon exercise of the warrants. All warrants expired on February 6, 2014.
14. EARNINGS PER SHARE
The following table sets forth the computation of basic and diluted earnings per share:
|
| | | | | | | | | | | | | | | |
Earnings Per Share |
| For the Years Ended | | For the One-Month Transition Period Ended December 31, 2012 |
| December 31, 2013 | | November 30, 2012 | | November 30, 2011 | |
Net income attributable to CORR Stockholders | $ | 4,502,339 |
| | $ | 12,348,721 |
| | $ | 2,922,143 |
| | $ | (1,503,396 | ) |
Basic and diluted weighted average shares (1) | 24,149,396 |
| | 9,182,425 |
| | 9,159,809 |
| | 15,564,861 |
|
Basic and diluted earnings per share attributable to CORR Stockholders | $ | 0.19 |
| | $ | 1.34 |
| | $ | 0.32 |
| | $ | (0.10 | ) |
| |
(1) | Warrants to purchase shares of common stock were outstanding during the periods reflected in the table above, but were not included in the computation of diluted earnings per share because the warrants’ exercise price was greater than the average market value of the common shares and, therefore, the effect would be anti-dilutive. |
The decrease in earnings per share for the year ended December 31, 2013 as compared to the year ended November 30, 2012 reflects the overall change in the business structure as the Company transitions out of securities-based transactions and into ownership and leasing of real property assets. Additionally, 14,950,000 shares were issued in the one-month transition period ended December 31, 2012.
15. Quarterly Financial Data (Unaudited)
|
| | | | | | | | | | | | | | | | |
| | For the Fiscal Quarters Ended |
| | March 31, 2013 | | June 30, 2013 | | September 30, 2013 | | December 31, 2013 |
Lease revenue | | $ | 5,638,244 |
| | $ | 5,638,244 |
| | $ | 5,638,244 |
| | $ | 5,638,244 |
|
Sales revenue | | 2,515,573 |
| | 1,929,772 |
| | 1,935,868 |
| | 2,351,831 |
|
Total revenue | | 8,153,817 |
| | 7,568,016 |
| | 7,574,112 |
| | 7,990,075 |
|
Cost of sales | | 2,003,639 |
| | 1,476,348 |
| | 1,411,318 |
| | 1,843,360 |
|
Management fees, net of expense reimbursements | | 643,814 |
| | 646,394 |
| | 647,380 |
| | 699,677 |
|
All other expenses | | 3,705,925 |
| | 3,845,005 |
| | 4,227,013 |
| | 3,880,512 |
|
Total expenses | | 6,353,378 |
| | 5,967,747 |
| | 6,285,711 |
| | 6,423,549 |
|
Income (loss) from operations, before income taxes | | 1,800,439 |
| | 1,600,269 |
| | 1,288,401 |
| | 1,566,526 |
|
Realized and unrealized gain (loss) on securities transactions, before income taxes | | 2,742,049 |
| | (30,976 | ) | | 872,020 |
| | 1,783,460 |
|
Distributions and income from investments, net | | 13,124 |
| | 2,701 |
| | 568,332 |
| | 657 |
|
Income tax expense (benefit), net | | (737,381 | ) | | (907,275 | ) | | (818,134 | ) | | (825,588 | ) |
Total other income (loss) and expense, net, before income taxes | | 2,017,792 |
| | (935,550 | ) | | 622,218 |
| | 958,529 |
|
Income (loss) before income taxes | | 3,818,231 |
| | 664,719 |
| | 1,910,619 |
| | 2,525,055 |
|
Current and deferred tax expense, net | | 1,020,944 |
| | 241,754 |
| | 1,105,125 |
| | 581,695 |
|
Net income | | $ | 2,797,287 |
| | $ | 422,965 |
| | $ | 805,494 |
| | $ | 1,943,360 |
|
Net income attributable to non-controlling interest | | $ | 384,534 |
| | $ | 352,893 |
| | $ | 366,042 |
| | $ | 363,297 |
|
Net income attributable to CORR stockholders | | $ | 2,412,753 |
| | $ | 70,072 |
| | $ | 439,452 |
| | $ | 1,580,063 |
|
Basic and diluted earnings per share | | $ | 0.10 |
| | $0.00 | | $ | 0.02 |
| | $ | 0.06 |
|
|
| | | | | | | | | | | | | | | | |
| | For the Fiscal Quarters Ended |
| | February 28, 2012 | | May 31, 2012 | | August 31, 2012 | | November 30, 2012 |
Sales revenue | | $ | 2,437,310 |
| | $ | 1,439,958 |
| | $ | 1,927,626 |
| | $ | 2,216,128 |
|
Lease income | | 638,244 |
| | 638,244 |
| | 638,244 |
| | 638,243 |
|
Total revenue | | 3,075,554 |
| | 2,078,202 |
| | 2,565,870 |
| | 2,854,371 |
|
Cost of sales | | 2,004,672 |
| | 1,031,114 |
| | 1,381,161 |
| | 1,661,155 |
|
Management fees, net of expense reimbursements | | 247,381 |
| | 254,965 |
| | 298,051 |
| | 246,399 |
|
All other expenses | | 599,865 |
| | 892,759 |
| | 1,082,911 |
| | 1,117,268 |
|
Total expenses | | 2,851,918 |
| | 2,178,838 |
| | 2,762,123 |
| | 3,024,822 |
|
Income (loss) from operations, before income taxes | | 223,636 |
| | (100,636 | ) | | (196,253 | ) | | (170,451 | ) |
Realized and unrealized gain (loss) on securities transactions, before income taxes | | 8,931,466 |
| | 3,237,325 |
| | 8,492,502 |
| | (479,416 | ) |
Distributions and income from investments, net | | 85,262 |
| | 55,462 |
| | (502,176 | ) | | 82,057 |
|
Interest Expense | | (27,409 | ) | | (25,229 | ) | | (16,780 | ) | | (11,705 | ) |
Total other income (loss) and expense, net, before income taxes | | 8,989,319 |
| | 3,267,558 |
| | 7,973,546 |
| | (409,064 | ) |
Income (loss) before income taxes | | 9,212,955 |
| | 3,166,922 |
| | 7,777,293 |
| | (579,515 | ) |
Current and deferred tax expense, net | | (3,465,914 | ) | | (1,190,162 | ) | | (2,788,785 | ) | | 215,927 |
|
Net income | | $ | 5,747,041 |
| | $ | 1,976,760 |
| | $ | 4,988,508 |
| | $ | (363,588 | ) |
Basic and diluted earnings (loss) per share | | $ | 0.63 |
| | $ | 0.21 |
| | $ | 0.54 |
| | $ | (0.04 | ) |
On February 5, 2013, the Board of Directors of the Company approved a change in the Company's fiscal year end from November 30 to December 31. This change to the calendar year reporting cycle began January 1, 2013. Financial information for the years ended December 31, 2012 and 2011 has not been included in this Form 10-K for the following reasons: (i) the years ended November 30, 2012 and 2011 provide as meaningful a comparison to the year ended December 31, 2013 as would the years ended December 31, 2012 and 2011; (ii) there are no significant factors, seasonal or other, that would impact the comparability of information if the results for the years ended December 31, 2012 and 2011 were presented in lieu of results for the years ended November 30, 2012 and 2011; and (iii) it was not practicable or cost justified to prepare this information.
16. CORENERGY HISTORICAL FINANCIALS
Summary Balance Sheets and Statements of Income for the one-month transition period ending December 31, 2012 and the comparative one-month period ended December 31, 2011 are presented below for comparative purposes. For further information please refer to the section with Management's Discussion and Analysis.
|
| | | | | | | |
CorEnergy Historical Summary Consolidated Balance Sheets |
| December 31, 2012 | | December 31, 2011 (Unaudited) |
Current assets | $ | 19,202,432 |
| | $ | 5,307,970 |
|
Non-current assets | 274,459,553 |
| | 90,623,108 |
|
Total Assets | $ | 293,661,985 |
| | $ | 95,931,078 |
|
| | | |
Current liabilities | $ | 8,290,065 |
| | $ | 1,552,281 |
|
Non-current liabilities | 74,529,728 |
| | 2,894,200 |
|
Total Liabilities | 82,819,793 |
| | 4,446,481 |
|
Shareholder's equity | 210,842,192 |
| | 91,484,597 |
|
Total Liabilities and Shareholder's Equity | $ | 293,661,985 |
| | $ | 95,931,078 |
|
| | | |
|
CorEnergy Historical Summary Consolidated Statements of Income |
| For the One- Month Transition Period Ended December 31, 2012 | | For the Comparative One- Month Transition Period Ended December 31, 2011 (Unaudited) |
Revenues | $ | 1,726,901 |
| | $ | 1,079,612 |
|
Expenses | 1,826,422 |
| | 993,919 |
|
Operating Income (Loss) | (99,521 | ) | | 85,693 |
|
Other Income (Expense), net | (2,342,365 | ) | | 1,601,084 |
|
Income (Loss) before income tax benefit (provision) | (2,441,886 | ) | | 1,686,777 |
|
Income tax benefit (provision) | 920,143 |
| | (628,493 | ) |
Net Income (Loss) | (1,521,743 | ) | | 1,058,284 |
|
Less: Net Income (Loss) attributable to non-controlling interest | (18,347 | ) | | — |
|
Net Income (Loss) attributable to CORR Stockholders | $ | (1,503,396 | ) | | $ | 1,058,284 |
|
17. SUBSEQUENT EVENTS
The Company performed an evaluation of subsequent events through the date of the issuance of these financial statements and determined that no additional items require recognition or disclosure, except for the following:
Dividend
The 2013 fourth quarter dividend was paid in the first quarter of 2014. On January 3, 2014, our Board declared a dividend of $0.125 per share, payable January 23, 2014 to common stockholders of record as of January 13, 2014.
Lease Agreement with Arc Terminals
On January 21, 2014, our subsidiary, LCP Oregon, closed on a Purchase and Sale Agreement. LCP Oregon acquired the Portland Terminal Facility, with certain associated real property rights (the “Acquisition”) for $40 million in cash.
LCP Oregon entered into a long-term triple net Lease Agreement on January 21, 2014, relating to the use of the Portland Terminal Facility (the “Portland Lease Agreement”) with Arc Terminals Holdings LLC ("Arc Terminals"), an indirect wholly-owned
subsidiary of Arc Logistics. Arc Logistics will guaranty the obligations of Arc Terminals under the Portland Lease Agreement. The Portland Lease Agreement grants Arc Terminals substantially all authority to operate, and imposes on them the responsibility for the operation of, the Portland Terminal Facility. During the initial term, Arc Terminals will make base monthly rental payments (to be increased on the fifth anniversary by the change in the consumer price index for the prior five years, and every year thereafter by the greater of 2 percent or the change in the consumer price index) and variable rent payments based on the volume of liquid hydrocarbons that flowed through the Portland Terminal Facility in the prior month. The base rent in the initial year of the Portland Lease Agreement increases to approximately $417,522 per month starting with August 2014 and each month thereafter. The base rent is also expected to increase during the initial year of the Portland Lease Agreement based on a percentage of specified construction costs at the Portland Terminal Facility incurred by LCP Oregon, estimated at $10 million. Variable rent is capped at 30 percent of total rent, which would be the equivalent of the Portland Terminal Facility’s expected throughput capacity.
On January 21, 2014, we closed a follow on public offering of 7,475,000 shares of common stock, raising approximately $49 million in gross proceeds at $6.50 per share (net proceeds of approximately $46 million after underwriters’ discount). The number of shares includes additional shares that were sold pursuant to an over-allotment option granted to the underwriters of CorEnergy’s public offering of 6,500,000 shares. The net proceeds from this offering were used to finance the Acquisition.
We financed the Acquisition with cash. Currently, the Portland Terminal Facility accounts for a significant portion of our total assets and the lease payments under the Portland Lease Agreement accounts for a significant portion of our total revenue.
Loan Agreement with Black Bison
On March 13, 2014, our subsidiary Corridor Bison, LLC ("Corridor Bison") entered into a Loan Agreement with Black Bison Water Services, LLC ("Water Services"), pursuant to which Corridor Bison agreed to loan to Water Services up to $11,500,000 (the "Loan"). The proceeds of the Loan are to be used by Water Services and its affiliates to finance the acquisition and development of real property that will provide water sourcing, water disposal, or water treating/recycling services for the oil and natural gas industry. Water Services' initial Loan draw in the amount of $4,265,000 was used to acquire real property in Wyoming and to pay Loan transaction expenses.
Interest will initially accrue on the outstanding principal amount of the Loan at an annual base rate of 12 percent, which base rate will increase by 2 percent of the current base rate per year. In addition, starting in April 2015 and continuing for each month thereafter, the outstanding principal of the Loan will bear variable interest calculated as a function of the increase in volume of water treated by Water Services during the particular month. The base rent plus variable rent is capped at 19 percent per annum. The Loan matures on March 31, 2024 and is to be amortized by quarterly payments beginning March 31, 2015 and annual pre-payments based upon free cash flows of the Borrower and its affiliates commencing in April 2015. The Loan is secured by the real property and equipment held by Water Services and the outstanding equity in Water Services and its affiliates. The Loan is also guarantied by all affiliates of Water Services.
As a condition to the Loan, Corridor Bison acquired a Warrant to purchase up to 15 percent of the outstanding equity of Black Bison Intermediate Holdings, LLC ("Intermediate Holdings"). Corridor Bison paid $34,000 for the Warrant, which amount was determined to represent the fair value of the Warrant as of the date of purchase. The exercise price of the Warrant, $3.16 per Unit, was determined based on the value of 15 percent of the contributed capital of Intermediate Holdings as of the date of purchase and increases at a rate of 12 percent per annum. The Warrant grants to Corridor Bison certain rights with respect to the management of the Intermediate Holdings and Water Services.
SCHEDULE I - CONDENSED FINANCIAL INFORMATION OF REGISTRANT - CorEnergy Infrastructure Trust, Inc.
CONDENSED BALANCE SHEETS
|
| | | | | | | | | | | |
| December 31, 2013 | | November 30, 2012 | | December 31, 2012 |
Assets | | | | | |
Leased property, net of accumulated depreciation of $3,790,570, $1,131,680, and $1,327,517 at December 31, 2013, November 30, 2012, and December 31, 2012, respectively | $ | 15,374,167 |
| | $ | 12,995,169 |
| | $ | 17,592,988 |
|
Other equity securities, at fair value | 134,796,867 |
| | 20,697,003 |
| | 151,857,174 |
|
Cash and cash equivalents | 16,649,618 |
| | 14,289,425 |
| | 16,504,354 |
|
Trading securities, at fair value | — |
| | 55,219,411 |
| | — |
|
Due from subsidiary | 3,972,006 |
| | — |
| | — |
|
Note receivable from subsidiary | 5,300,000 |
| | 3,800,000 |
| | 5,300,000 |
|
Escrow receivable | — |
| | 698,729 |
| | — |
|
Lease receivable | 711,229 |
| | — |
| | — |
|
Intangible lease asset, net of accumulated amortization of $729,847, $413,580, and $437,908 at December 31, 2013, November 30, 2012, and December 31, 2012 respectively | 364,924 |
| | 681,191 |
| | 656,863 |
|
Deferred debt issuance costs, net of accumulated amortization of $56,019, $0 and $448 at December 31, 2013, November 30, 2012, and December 31, 2012, respectively | 235,693 |
| | — |
| | 41,262 |
|
Deferred lease costs, net of accumulated amortization of $5,490, $0, and $172 at December 31, 2013, November 30, 2012, and December 31, 2012, respectively | 74,286 |
| | — |
| | 79,604 |
|
Income tax receivable | 512,060 |
| | — |
| | — |
|
Prepaid expenses and other assets | 156,153 |
| | 2,078,724 |
| | 75,665 |
|
Total Assets | $ | 178,147,003 |
| | $ | 110,459,652 |
| | $ | 192,107,910 |
|
Liabilities and Equity | | | | | |
Long-term debt | $ | — |
| | $ | — |
| | $ | — |
|
Accounts payable and other accrued liabilities | — |
| | 2,060,972 |
| | 2,928,431 |
|
Dividends payable to shareholders | 1,731,066 |
| | — |
| | — |
|
Distributions payable to non-controlling interest | — |
| | — |
| | — |
|
Lease obligation | — |
| | — |
| | — |
|
Income tax liability | — |
| | — |
| | 3,789,212 |
|
Deferred tax liability | — |
| | 7,172,133 |
| | 2,396,043 |
|
Line of credit | — |
| | — |
| | — |
|
Unearned revenue | — |
| | 2,370,762 |
| | 2,133,685 |
|
Total Liabilities | $ | 1,731,066 |
| | $ | 11,603,867 |
| | $ | 11,247,371 |
|
Equity |
| |
| |
|
Warrants, no par value; 945,594 issued and outstanding at December 31, 2013, November 30, 2012, and December 31, 2012 (5,000,000 authorized) | $ | 1,370,700 |
| | $ | 1,370,700 |
| | $ | 1,370,700 |
|
Capital stock, non-convertible, $0.001 par value; 24,156,163 shares issued and outstanding at December 31, 2013, 9,190,667 shares issued and outstanding at November 30, 2012, and 24,140,667 shares issued and outstanding at December 31, 2012 (100,000,000 shares authorized) | 24,156 |
| | 9,191 |
| | 24,141 |
|
Additional paid-in capital | 173,441,019 |
| | 91,763,475 |
| | 175,256,675 |
|
Accumulated retained earnings | 1,580,062 |
| | 5,712,419 |
| | 4,209,023 |
|
Accumulated other comprehensive income | — |
| | — |
| | — |
|
Total Equity | 176,415,937 |
| | 98,855,785 |
| | 180,860,539 |
|
Total Liabilities and Equity | $ | 178,147,003 |
| | $ | 110,459,652 |
| | $ | 192,107,910 |
|
SCHEDULE I - CONDENSED FINANCIAL INFORMATION OF REGISTRANT - CorEnergy Infrastructure Trust, Inc. - Continued
CONDENSED STATEMENTS OF INCOME
|
| | | | | | | | | | | | | | | |
| For the Years Ended | | For the One-Month Transition Period Ended
December 31, 2012 |
| December 31, 2013 | | November 30, 2012 | | November 30, 2011 | |
Revenue | | | | | | | |
Lease revenue | $ | 2,552,976 |
| | $ | 2,552,975 |
| | $ | 1,063,740 |
| | $ | 212,748 |
|
Earnings (loss) from subsidiary | 5,720,413 |
| | 356,336 |
| | 86,967 |
| | (22,313 | ) |
Total Revenue | 8,273,389 |
| | 2,909,311 |
| | 1,150,707 |
| | 190,435 |
|
Expenses | | | | | | | |
Management fees, net of expense reimbursements | 366,863 |
| | 1,046,796 |
| | 968,163 |
| | 155,242 |
|
Asset acquisition expenses | 806,083 |
| | 377,834 |
| | 638,185 |
| | 64,734 |
|
Professional fees | 198,562 |
| | 1,141,045 |
| | 548,759 |
| | 282,303 |
|
Depreciation expense | 2,463,052 |
| | 837,371 |
| | 294,309 |
| | 195,838 |
|
Amortization expense | 5,320 |
| | — |
| | — |
| | 172 |
|
Directors’ fees | 24,788 |
| | 85,050 |
| | 70,192 |
| | 6,000 |
|
Other expenses | 113,001 |
| | 232,248 |
| | 205,795 |
| | 27,500 |
|
Total Expenses | 3,977,669 |
| | 3,720,344 |
| | 2,725,403 |
| | 731,789 |
|
Operating Income (Loss) | $ | 4,295,720 |
| | $ | (811,033 | ) | | $ | (1,574,696 | ) | | $ | (541,354 | ) |
Other Income (Expense) |
| |
| |
| |
|
Net distributions and dividend income | $ | 6,681 |
| | $ | 261,472 |
| | $ | 786,151 |
| | $ | 48,136 |
|
Net realized and unrealized gain (loss) on trading securities | — |
| | 4,009,933 |
| | 2,299,975 |
| | (1,769,058 | ) |
Net realized and unrealized gain (loss) on other equity securities | — |
| | 16,171,944 |
| | 2,283,773 |
| | (159,495 | ) |
Other Income | — |
| | — |
| | 40,000 |
| | — |
|
Interest expense (income) | (703,091 | ) | | 54,661 |
| | 30,203 |
| | 1,768 |
|
Total Other Income (Expense) | 709,772 |
| | 20,388,688 |
| | 5,379,696 |
| | (1,882,185 | ) |
Income (Loss) before income taxes | 5,005,492 |
| | 19,577,655 |
| | 3,805,000 |
| | (2,423,539 | ) |
Taxes |
| |
| |
| |
|
Current tax expense (benefit) | (540,111 | ) | | 29,265 |
| | 253,650 |
| | 3,855,947 |
|
Deferred tax expense (benefit) | 1,043,264 |
| | 7,199,669 |
| | 629,207 |
| | (4,776,090 | ) |
Income tax expense (benefit), net | 503,153 |
| | 7,228,934 |
| | 882,857 |
| | (920,143 | ) |
Net Income (Loss) | 4,502,339 |
| | 12,348,721 |
| | 2,922,143 |
| | (1,503,396 | ) |
SCHEDULE I - CONDENSED FINANCIAL INFORMATION OF REGISTRANT - CorEnergy Infrastructure Trust, Inc. - Continued
CONDENSED STATEMENTS OF CASH FLOW
|
| | | | | | | | | | | | | | | |
| For the Years Ended | | For the One-Month Transition Period Ended
December 31, 2012 |
| December 31, 2013 | | November 30, 2012 | | November 30, 2011 | |
Net cash provided by operating activities | $ | (2,323,743 | ) | | $ | 8,322,354 |
| | $ | 2,371,895 |
| | $ | (2,485,923 | ) |
Investing Activities | | | | | | | |
Purchases of long-term investments of trading and other equity securities | — |
| | — |
| | (38,147,249 | ) | | — |
|
Proceeds from sale of long-term investment of trading and other equity securities | — |
| | 9,983,169 |
| | 53,950,583 |
| | — |
|
Deferred lease costs | — |
| | 704,164 |
| | — |
| | (30,000 | ) |
Investment in consolidated subsidiaries | (5,716,911 | ) | | (73,256 | ) | | — |
| | (80,271,592 | ) |
Cash distributions from consolidated subsidiaries | 19,337,911 |
| | — |
| | 71,023 |
| | 483,346 |
|
Acquisition expenditures | (1,651,956 | ) | | (750,591 | ) | | — |
| | 2,318 |
|
Cash paid in business combination | — |
| | — |
| | (12,250,000 | ) | | — |
|
Net cash provided by investing activities | $ | 11,969,044 |
| | $ | 9,863,486 |
| | $ | 3,624,357 |
| | $ | (79,815,928 | ) |
Financing Activities | | | | | | | |
Debt financing costs | (30,002 | ) | | (527,246 | ) | | — |
| | — |
|
Net offering proceeds | (523,094 | ) | | — |
| | — |
| | 84,516,780 |
|
Dividends | (8,946,941 | ) | | (3,919,249 | ) | | (3,503,365 | ) | | — |
|
Payments on long-term debt | — |
| | (2,188,000 | ) | | (1,221,000 | ) | | — |
|
Net cash used in financing activities | $ | (9,500,037 | ) | | $ | (6,634,495 | ) | | $ | (4,724,365 | ) | | $ | 84,516,780 |
|
Net Change in Cash and Cash Equivalents | $ | 145,264 |
| | $ | 11,551,345 |
| | $ | 1,271,887 |
| | $ | 2,214,929 |
|
Cash and Cash Equivalents at beginning of period | 16,504,354 |
| | 2,738,080 |
| | 1,466,193 |
| | 14,289,425 |
|
Cash and Cash Equivalents at end of period | $ | 16,649,618 |
| | $ | 14,289,425 |
| | $ | 2,738,080 |
| | $ | 16,504,354 |
|
See accompanying notes to condensed financial statements. | | | | | | | |
|
| | | | | | | | | | | | | | | |
Supplemental Disclosure of Cash Flow Information | | | | | | | |
Interest paid | To be filled |
| | $ | 176,595 |
| | $ | 176,595 |
| | $ | 2,765 |
|
Income taxes paid (net of refunds) | $ | 3,761,161 |
| | $ | 253,650 |
| | $ | 253,650 |
| | $ | — |
|
Non-Cash Investing Activities | | | | | | | |
Security proceeds from sale in long-term investment of other equity securities | $ | — |
| | $ | 25,565,400 |
| | $ | — |
| | $ | — |
|
Reclassification of prepaid expenses and other assets to deferred lease costs | $ | — |
| | $ | — |
| | $ | — |
| | $ | 753,940 |
|
Reclassification of prepaid expenses and other assets to acquisition expenditures | $ | — |
| | $ | — |
| | $ | — |
| | $ | 188,766 |
|
Change in accounts payable and accrued expenses related to deferred lease costs | $ | — |
| | $ | 704,164 |
| | $ | — |
| | $ | (704,164 | ) |
Change in accounts payable and accrued expenses related to acquisition expenditures | $ | (1,407,724 | ) | | $ | 192,116 |
| | $ | — |
| | $ | 1,560,993 |
|
Non-Cash Financing Activities | | | | | | | |
Reclassification of prepaid expenses and other assets to issuance of equity | $ | — |
| | $ | — |
| | $ | — |
| | $ | 617,308 |
|
Reclassification of prepaid expenses and other assets to deferred loan costs | $ | — |
| | $ | (1,054,302 | ) | | $ | — |
| | $ | 436,994 |
|
Change in accounts payable and accrued expenses related to the issuance of equity | $ | (523,094 | ) | | $ | — |
| | $ | — |
| | $ | 391,322 |
|
Change in accounts payable and accrued expenses related to debt financing costs | $ | 220,000 |
| | $ | 527,056 |
| | $ | — |
| | $ | (395,284 | ) |
Reinvestment of distributions by common stockholders in additional common shares | $ | 108,119 |
| | $ | 121,024 |
| | $ | 252,242 |
| | $ | — |
|
NOTES TO CONDENSED FINANCIAL STATEMENTS
NOTE A - BASIS OF PRESENTATION
In the parent-company-only financial statements, the Company's investment in subsidiaries is stated at cost plus equity in undistributed earnings of subsidiaries since the date of acquisition. The parent-company-only financial statements should be read in conjunction with the Company's consolidated financial statements.
NOTE B - DIVIDENDS FROM SUBSIDIARIES
Cash dividends paid to CorEnergy Infrastructure Trust, Inc. from the Company's consolidated subsidiaries were $19,337,911, $71,023 and $483,346 for the years ended December 31, 2013 and November 30, 2011 and for the one-month transition period ended December 31, 2012, respectively.
SCHEDULE III - REAL ESTATE AND ACCUMULATED DEPRECIATION - CorEnergy Infrastructure Trust, Inc.
|
| | | | | | | | | | | | | | | | | | | | | | | | | | | | | | | | | | | | | | | | |
| | | | | | Initial Cost to Company | | Cost Capitalized Subsequent to Acquisition | | Gross Amount Carried at Close of Period 12/31/13 | | | | | | |
Description | | Location | | Date Acquired | | Land | | Building & Fixtures | | Improvements | | Land | | Building & Fixtures | | Total | | Accumulated Depreciation | | Investment in Real Estate, Net at 12/31/13 | | Encumbrances |
Pinedale LGS | | Pinedale, WY | | 2012 | | $ | 104,315,000 |
| | $ | 123,731,215 |
| | $ | 2,557,910 |
| | $ | 104,315,000 |
| | $ | 126,289,125 |
| | $ | 230,604,125 |
| | $ | 9,154,337 |
| | $ | 221,449,788 |
| | $ | 70,000,000 |
|
Eastern Interconnect Project | | Albuquerque, NM | | 2011 | | — |
| | 14,126,849 |
| | — |
| | — |
| | 14,126,849 |
| | 14,126,849 |
| | 3,600,251 |
| | 10,526,598 |
| | — |
|
| | | | | | $ | 104,315,000 |
| | $ | 137,858,064 |
| | $ | 2,557,910 |
| | $ | 104,315,000 |
| | $ | 140,415,974 |
| | $ | 244,730,974 |
| | $ | 12,754,588 |
| | $ | 231,976,386 |
| | $ | 70,000,000 |
|
Pre-Acquisition Costs | | | | | | $ | — |
| | $ | 244,232 |
| | $ | — |
| | $ | — |
| | $ | 244,232 |
| | $ | 244,232 |
| | $ | — |
| | $ | 244,232 |
| | $ | — |
|
| | | | | | $ | 104,315,000 |
| | $ | 138,102,296 |
| | $ | 2,557,910 |
| | $ | 104,315,000 |
| | $ | 140,660,206 |
| | $ | 244,975,206 |
| | $ | 12,754,588 |
| | $ | 232,220,618 |
| | $ | 70,000,000 |
|
NOTES TO SCHEDULE III - CONSOLIDATED REAL ESTATE AND ACCUMULATED DEPRECIATION
(a) Reconciliation of "Real Estate and Accumulated Depreciation"
|
| | | | | | | | | | | | | | | |
| For the Years Ended | | For the One-Month Transition Period Ended December 31, 2012 |
| December 31, 2013 | | November 30, 2012 | | November 30, 2011 | |
Investment in real estate: | | | | | | | |
Balance, beginning of year | $ | 244,686,333 |
| | $ | 14,126,849 |
| | $ | — |
| | $ | 14,126,849 |
|
Addition: Acquisitions and developments | 288,873 |
| | — |
| | 14,126,849 |
| | 230,559,484 |
|
Deduction: Dispositions and other | — |
| | — |
| | — |
| | — |
|
Balance, end of year | $ | 244,975,206 |
| | $ | 14,126,849 |
| | $ | 14,126,849 |
| | $ | 244,686,333 |
|
Accumulated depreciation: | | | | | | | |
Balance, beginning of year | $ | 1,607,624 |
| | $ | 294,309 |
| | $ | — |
| | $ | 1,131,680 |
|
Addition: Depreciation | 11,146,964 |
| | 837,371 |
| | 294,309 |
| | 475,944 |
|
Deduction: Dispositions and other | — |
| | — |
| | — |
| | — |
|
Balance, end of year | $ | 12,754,588 |
| | $ | 1,131,680 |
| | $ | 294,309 |
| | $ | 1,607,624 |
|
At December 31, 2013, the aggregate cost of the properties is approximately $11,378,747 lower for federal income tax purposes at December 31, 2013.
CORENERGY INFRASTRUCTURE TRUST, INC.
SIGNATURES
Pursuant to the requirements of Section 13 or 15(d) of the Securities Exchange Act of 1934, the registrant has duly caused this report to be signed on its behalf by the undersigned, thereunto duly authorized.
|
| | |
CORENERGY INFRASTRUCTURE TRUST, INC. |
| | (Registrant) |
| | |
By: | | /s/ Rebecca M. Sandring |
| | Rebecca M. Sandring |
| | Chief Accounting Officer |
| | (Principal Accounting and Principal Financial Officer) |
| | |
| | March 17, 2014 |
Pursuant to the requirements of the Securities Exchange Act of 1934, this report has been signed below by the following persons on behalf of the registrant and in the capacities and on the dates indicated.
|
| | | |
Signature | | Title | Date |
/s/ David J. Schulte | | Chief Executive Officer and Director (Principal Executive Officer) | March 17, 2014 |
David J. Schulte | | |
| | | |
/s/ Rebecca M. Sandring | | Chief Accounting Officer (Principal Accounting and Principal Financial Officer) | March 17, 2014 |
Rebecca M. Sandring | | |
| | | |
/s/ Richard C. Green | | Chairman of the Board | March 17, 2014 |
Richard C. Green | | | |
| | | |
/s/ Barrett Brady | | Director | March 17, 2014 |
Barrett Brady | | | |
| | | |
/s/ Conrad S. Ciccotello | | Director | March 17, 2014 |
Conrad S. Ciccotello | | | |
| | | |
/s/ Catherine A. Lewis | | Director | March 17, 2014 |
Catherine A. Lewis | | | |
| | | |
| | Director | March 17, 2014 |
Charles E. Heath | | | |