Exhibit 99.1
 
 LISTED  CORR  NYSE  Investor PresentationApril 2016   
 

 This presentation contains certain statements that may include "forward-looking statements" within the meaning of Section 27A of the Securities Act of 1933 and Section 21E of the Securities Exchange Act of 1934. All statements, other than statements of historical fact, included herein are "forward-looking statements." Although CorEnergy believes that the expectations reflected in these forward-looking statements are reasonable, they do involve assumptions, risks and uncertainties, and these expectations may prove to be incorrect. Actual results could differ materially from those anticipated in these forward-looking statements as a result of a variety of factors, including those discussed in CorEnergy’s reports that are filed with the Securities and Exchange Commission. You should not place undue reliance on these forward-looking statements, which speak only as of the date of this presentation. Other than as required by law, CorEnergy does not assume a duty to update any forward-looking statement. In particular, any distribution paid in the future to our stockholders will depend on the actual performance of CorEnergy, its costs of leverage and other operating expenses and will be subject to the approval of CorEnergy’s Board of Directors and compliance with leverage covenants.  Disclaimer 
 

 CORR Provides Direct Access to Energy Infrastructure   Assets which are critical to tenant / customer operationsLong-term leases with predictable base rents having inflationary protectionRents are classified as operating expense on tenant / customer’s income statementBase and participating rents expected to deliver total returns of 8-10% on assetsLong-term dividend growth of 3-5%, inclusive of acquisitions  Utility-like cash flow profile  Allows energy companies to maintain control of operations while monetizing assets1099 infrastructure access for institutional, tax exempt and non-US investors (no K-1, UBTI or ECI)REITs are not investment companies, but are eligible to be owned by investment companies  REIT Structure SUITABILITY 
 

   CORR Assets Diversified Across Energy Value Chain  UPSTREAM MIDSTREAM DOWNSTREAM     SWD facilities    Portland Terminal    Pinedale LGS    Omega Pipeline    MoGas Pipeline    Grand Isle Gathering System 
 

 Pinedale LGS Case Study  $228 million asset, acquired with Prudential as a co-investor150 miles of pipelines, 107 receipt points, 4 above-ground facilitiesCritical to operation of Ultra Petroleum’s Pinedale natural gas field15-year triple-net lease; rent $20 million per year + participating features       Pinedale Liquids Gathering System 
 

 CORR’s LGS: From the Well Pads to the Market      
 

 Common Criteria Favors our Assets and Contracts  "A termination of the Pinedale Lease Agreement would significantly disrupt our ability to produce oil and gas from Pinedale field which would have a material adverse effect on our business, financial condition, results of operations, and cash flows1….”  “…Any termination of our transportation agreement on REX would not have a material adverse effect on our ability to market our production.1”  (1) Ultra Petroleum 2015 Form 10-K 
 

 Grand Isle Gathering System Case Study  ~$250 million critical midstream infrastructure in the Gulf of Mexico153 miles of undersea pipeline and terminal with separation, SWD and storage facilitiesEssential system to transport crude oil and produced water for large proven reservesTriple net operating lease with Energy XXI – average annual minimum rent of ~$40 million       (1) For EXXI fiscal year ended June 2014; source EXXI filings and presentations                                                                                                                                                                                                                                                                    Grand Isle Terminal    Louisiana    Non-GIGS Pipeline    Third Party Platform    EXXI Platform        GIGS transports ~42% of EXXI’s production1 
 

   Energy XXI Ltd and substantially all of its subsidiaries filed for Chapter 11 on April 14, 2016Energy XXI Ltd is the guarantor of the Grand Isle Gathering System LeaseA bankruptcy or missed interest payment on certain debt by the guarantor would have caused a default of the GIGS LeaseCORR provided a conditional waiver of certain remedies of the defaultsEnergy XXI GIGS Services, the tenant of GIGS, did not file for bankruptcyAll obligations under the lease are currently not subject to the proceedingsEnergy XXI GIGS Services has been named, and approved in the interim, as a Critical Vendor to the indebted groupWe expect the tenant to remain compliant with the lease during, and following, bankruptcy  CORR Tenant Remains Outside Energy XXI Ltd Bankruptcy 
 

 Payment Priority of Rent Confirms Utility-Like Risk Profile of CORR Revenue  (1) Ultra Petroleum 2015 Form 10-K(2) Excluding retirement obligations, gains, losses and impairments(3) Energy XXI Ltd 8-K Filing, April 14, 2016  EXXI has cash interest costs & dividends of $14/BOE which should largely be extinguished following restructuring  Includes CorEnergy Lease Payments  Our assessment of the criticality of our assets is being supported in a stressed environment 
 

 CORR Enjoys High Capital Returns After Reinvestment  Analysis of assets’ useful life through in-house and third-party due diligencePinedale and GIGS have finite terminal valuePortland and MoGas have market terminal valueCORR capitalization rate is higher than most other REITs even after use of capital to reinvest over the lives of our assets1CORR revenues from tenants include capital replacement for assets with finite terminal value (Pinedale and GIGS)Reinvestments can include asset acquisitions or repayment of debtDistributions are based on CORR’s return on, not return of capital  (1) Wells Fargo Securities Market Research 
 

 Corporate Structure Alignment with Investors  CORR Expense Metrics vs. Peer Group1       Management Agreement  Base Fee  Incentive Fee  Administration Fee  Grand Isle Gathering System  PinedaleLGS  MoGasPipeline  PortlandTerminal  SWDFacilities  OmegaPipeline      Assets  Fees  Management FeeServices provided:Presents the Company with suitable acquisition opportunities, responsible for the day-to-day operations of the Company and performs such services and activities relating to the assets and operations of the Company as may be appropriateBase Fees paid: Quarterly management fee equal to 0.25 percent (1.00 percent annualized) of the value of the Company’s Managed Assets3 as of the end of each quarterIncentive Fees paid: Quarterly incentive fee of 10 percent of the increase in distributions earned over a threshold distribution equal to $0.625 per share per quarter. The Management Agreement also requires at least half of any incentive fees to be reinvested in the Company’s common stockAdministrative FeeServices provided:Performs (or oversees or arranges for the performance of) the administrative services necessary for our operation, including without limitation providing us with equipment, clerical, bookkeeping and record keeping servicesFees paid: 0.04 percent of our aggregate average daily Managed Assets, with a minimum annual fee of $30 thousand  External Fee Structure   Corporate Structure  Peer group consists of REITs included in the RMZ index under $1BN market capGross Asset Value = Asset Value of Investment Properties + Accumulated Depreciation“Managed Assets” is defined as Total Assets of CORR minus the initial invested value of non-controlling interests, the value of any hedged derivative assets, any prepaid expenses, all of the accrued liabilities other than deferred taxes and debt entered into for the purposed of leverage 
 

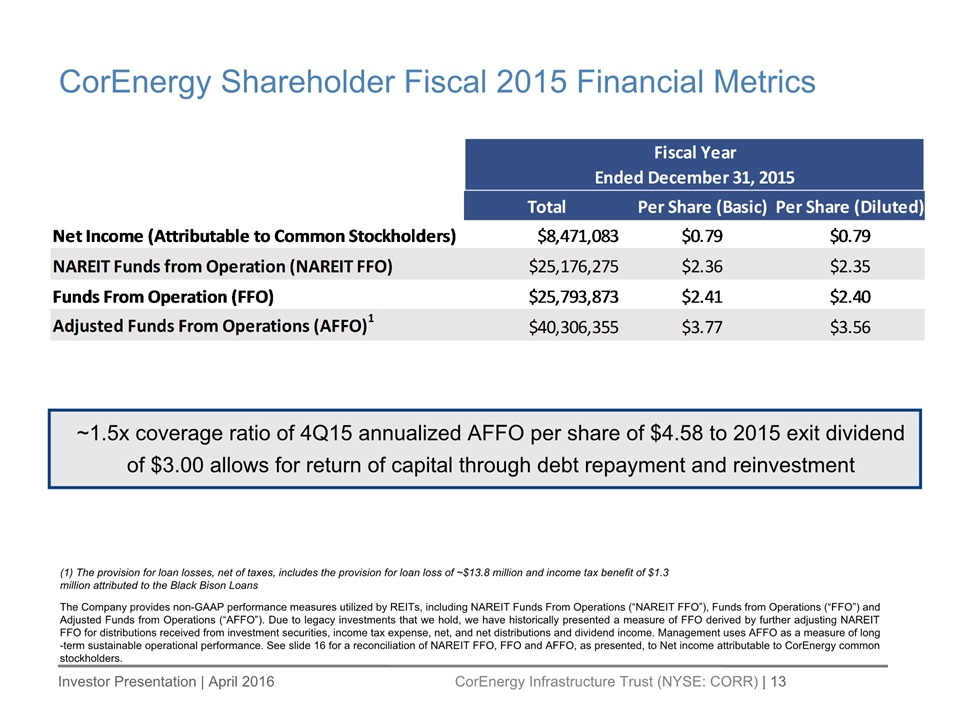
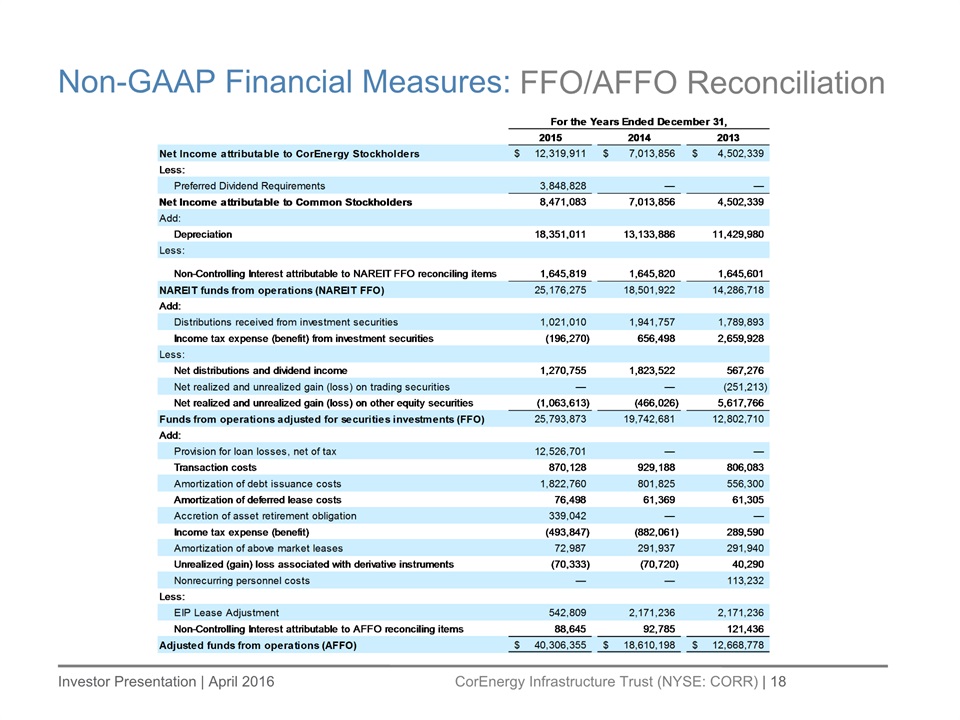
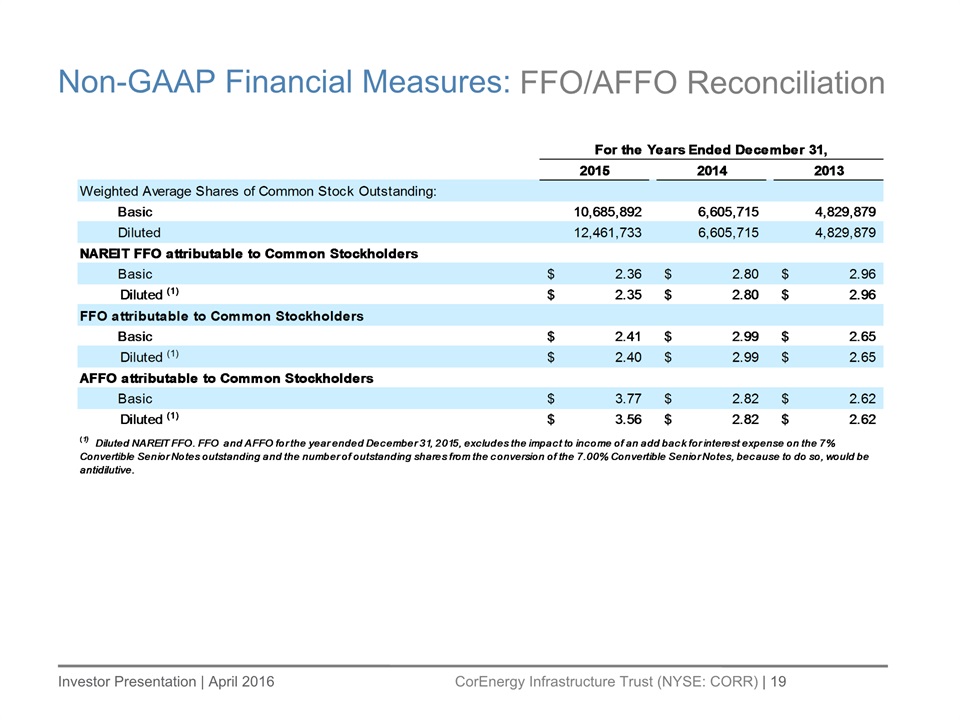
 The Company provides non-GAAP performance measures utilized by REITs, including NAREIT Funds From Operations (“NAREIT FFO”), Funds from Operations (“FFO”) and Adjusted Funds from Operations (“AFFO”). Due to legacy investments that we hold, we have historically presented a measure of FFO derived by further adjusting NAREIT FFO for distributions received from investment securities, income tax expense, net, and net distributions and dividend income. Management uses AFFO as a measure of long-term sustainable operational performance. See slide 16 for a reconciliation of NAREIT FFO, FFO and AFFO, as presented, to Net income attributable to CorEnergy common stockholders.  CorEnergy Shareholder Fiscal 2015 Financial Metrics  (1) The provision for loan losses, net of taxes, includes the provision for loan loss of ~$13.8 million and income tax benefit of $1.3 million attributed to the Black Bison Loans  ~1.5x coverage ratio of 4Q15 annualized AFFO per share of $4.58 to 2015 exit dividend of $3.00 allows for return of capital through debt repayment and reinvestment 
 

 Recurring and Sustained Performance  Asset Growth Drives Dividend Growth  (1) Is a non-GAAP measure that equals Total Lease Revenue, Security Distributions, Financing Revenue and Operating Results. See the appendix and MD&A of Forms 10-K and 10-Q.   Contribution Margin1  (2) Exit dividend for each fiscal period, annualized  Dividends Per Share2  Total Assets  Contribution Margin represents our operating performance, pre-G&ANet of commodity purchases and sales, and operating costsContribution Margin in 2016 expected to be ~$84.5 million, excluding acquisitions~12% return on assets, before debt repayment and reinvestmentAchieving total return target of 8-10%Asset acquisitions have driven average dividend growth of 7% per year since 2013  $84.5  4Q, ann. 
 

 Conservative Capitalization Structure  Capitalization   Preferred to Total Equity Ratio: Adjusted ratio of 13.5%, below our 33% target  Financing Ratios Remain Well Below Targets  Total Debt to Total Capitalization Ratio: Adjusted ratio of ~34%, within our target range of 25-50%  Conservative capital structure limits risk of high fixed costs, such as interest and preferred dividend paymentsRatio of Earnings to Fixed Charges: 2.3xRatio of Earnings to Fixed Charges and Preferred Dividends: 1.7xCorEnergy refinanced the Pinedale Credit Facility in March 2016Remaining liquidity on revolver and in cash is over $60 million 
 

 CorEnergy Thesis for Dividend Stability  Investments in critical infrastructure assets, which tenant operations rely uponBase and participating rents are expected to deliver total returns of 8-10% on CORR investments in assetsCORR investor returns are after debt repayment and reinvestment$3.00 annualized dividend represents sustainable payout  
 

 Appendix 
 

 Non-GAAP Financial Measures:  FFO/AFFO Reconciliation  
 

 Non-GAAP Financial Measures:  FFO/AFFO Reconciliation  
 

 Non-GAAP Financial Measures:  Contribution Margin1 
 

 Non-GAAP Financial Measures:  Contribution Margin1 
 

 Non-GAAP Financial Measures:  Fixed-Charges Coverage 
 

 For more information please visit our website at corenergy.corridortrust.comOr contact Investor Relations directly at: 877-699-CORRinfo@corridortrust.com